Another important step when working with the Profitunity system is analysis using a balance curve. We can call this method the fifth dimension of the market situation. The main objective of the method is to determine the signal before the corresponding Forex fractal appears.
The balance represents the line at which the price would be guided if it were not for the incoming new information that affects the market in the present time. In order to understand how much new information has an impact on the market, we can analyze the distance between the current value of the asset and the balance sheet.
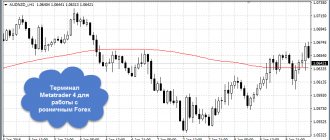
In order to more easily perceive the information received, it is worth considering the balance as the top of a mountain. If new information comes to the market, it will be much easier for him to move away from the balance sheet. That is, it is much easier to go down than to go up. Thanks to the balance, we can see the direction in which the price could go with the least resistance. If you carefully study the screenshot, you will see that the price first went by 212 points and then began to move closer to the balance line.
The main goal that we pursue when working with this strategy is to find an opportunity to enter the market at the moment when the price moves away from the balance line.
Purchase balance line
Signals to open a long position (the market is above the balance level):
- read the graph from right to left;
- we pay attention to the maximum values only when we are looking for signals to open a long position;
- the base candle is the starting point;
- First of all, you need to determine the base candle. To find it, you need to find the candle with the smallest maximum value;
- after this, you need to find a new maximum value to open a position.
Signals to open a long position (market below balance):
- the graph is read from right to left;
- maximum values should be considered only when we are looking for signals to open a long position;
- the base candle is the starting point for analysis. It must be found first. To determine it, you need to find the bar with the minimum maximum value. In order to open a long position after this, you need to find two new maximum values that will be higher than the previous one.
What is balance in Forex
Balance in Forex is the state of a trading account. It changes after each transaction. In other words, this is a summary of all financial movements in the trader’s account.
Equity
In addition to the funds in the account, the concept of “balance” includes all trading transactions (closed profitable and losing trades) and non-trading transactions.
How to determine balance on Forex
You can find out what a Forex balance is in the financial report sent by the broker. The amount includes:
- money lying on deposit;
- results of all closed transactions;
- withdrawing money and replenishing your account;
- brokerage commissions.
The amounts of withdrawals and losing trades are expressed in negative numbers. The daily report reflects the number of profitable and unprofitable transactions and the maximum drawdown - the amount of the largest loss.
Sales balance line
Opening a short position (market above balance):
- the graph is read from right to left;
- minimums are taken into account solely to search for sell signals;
- the starting point is the base candle. It needs to be defined first. To do this, we find the candle with the highest low. Next, we look for two other lows in order to open a short position.
Signals to open a short position (market below balance):
- the graph is read from right to left;
- minimums are taken into account only when searching for signals to open a short position;
- The base candle is considered as a starting point. It needs to be defined. To do this, find a candle with the smallest minimum value. Then, to enter the market, a new low is found.
Differences between equity and account balance in Forex
Many novice traders do not understand what balance is in Forex and how it differs from equity.
When calculating the balance, only closed transactions are taken into account. The amount does not include the trader’s open positions, as well as collateral (margin).
Equity account
The ratio of equity and balance on Forex can be equal if:
- There are currently no open transactions;
- the total profit and loss on open positions are equal to zero.
The balance amount increases after a profitable transaction and decreases after a losing one. Equity may be less than balance if:
- there are open transactions with a strong drawdown;
- the profit does not cover the size of the swap and the broker's commission.
Thus, in the Forex market, balance is a more static concept. It only takes into account closed positions and completed transactions. Equity is dynamic and includes all changes, incl. open transactions.
Trading in different zones using balance line signals
Once you have studied all the information described above, you can add certain factors that make the work a little more complicated. It is thanks to this complication that profits from transactions grow rapidly. These factors can be called filters.
The Alligator indicator will be used as the first such filter. Regardless of the signal received, you should only respond to one that is formed outside the Alligator’s “mouth”. The direction of movement should indicate that this signal will remain outside the mouth.
The second filter is the zone in which the price is located. If it is red but the price is above the balance and we want to go long, we need to identify the starting candle as well as the other two candles that have higher highs.
In another situation, when the price is above the balance and in the green zone, and we are looking for an opportunity to open a short position, we do not need to find four lower lows. In order to look for signals to buy in the red or sell in the green zones, you need to double the signal requirements.
Market equilibrium
So, the market demand curve describes the behavior of buyers, and the market supply curve describes the behavior of producers regarding a specific product. Their combination in one market space characterizes the market for this product (see Fig. 5.4.1.).
Rice. 5.4.1. Market equilibrium
The intersection point of the E0 curves (equilibrium) is called the market equilibrium (optimum), which has an equilibrium price - P0 and an equilibrium quantity - Q0.
Market equilibrium is a state of the market when the desires and capabilities of sellers and buyers regarding the price and quantity of a product coincide completely. The equilibrium state of the market is characterized by the absence of incentives for sellers and buyers to change the existing situation, but it can be disrupted from the outside.
The price at which a product is actually bought and sold is called the market price, and it does not necessarily coincide with the equilibrium price, and therefore the equilibrium and real sales volumes do not coincide. In this case, 2 market states are possible: overproduction, when the market is above the equilibrium point, and shortage, when it is located below the equilibrium point (see Fig. 5.4.2.).
Fig.5.4.2. Deficiency and overproduction
Market equilibrium is inherently unstable, because the market conditions that determine it are constantly changing, causing fluctuations in supply and demand. The result of these fluctuations is the restoration of equilibrium at the previous or new level. Market imbalance can occur in two cases: either when the market price deviates from the equilibrium price, or when non-price factors of supply and demand change.
1st case . Price has a balancing function. If the market price for any reason turns out to be higher than the equilibrium price (see Fig. 5.4.3.)
Rice. 5.4.3. Balancing price function
(P1>P0), then the volume of demand Qd1 will be less than the equilibrium Q0, and the number of people willing to sell at this price will increase, as a result of which the real volume of sales Qs1 exceeds the equilibrium Q0. A clearly visible excess of supply over demand will lead to overstocking of the market. (Qs1-Qd1). To get rid of excess goods, sellers will begin to reduce prices and manufacturers will reduce production. As the market price decreases, buyers will begin to become more active, placing increasing demand for the product. This will continue until the surplus of goods disappears and the market is thus restored to equilibrium.
In the opposite situation, i.e. if the market price P2 is below the equilibrium price P0, a shortage occurs. There will be more people willing to buy cheap goods and the volume of demand will reach Qd2. On the contrary, the number of sellers will decrease and supply will be equal to Qs2, as a result Qd2 > Qs2. Focusing on active demand, sellers will begin to raise prices. Producers will revive, expanding output, and on the other hand, rising prices will reduce excess demand. As a result of these processes, the market will also return to its previous equilibrium state.
2nd case. As a result of changes in non-price factors of supply and demand, equilibrium is established at a new level. There are 3 possible situations.
A). Change only non-price factors of demand. For example, a product has become fashionable, so the demand for it has increased. This will lead to a shift of the demand curve upward - to the right (see Fig. 5.4.4.).
Rice. 5.4.4. The effect of shifting the demand curve
Specifically, we are talking about the fact that the volume of demanded goods of a given type has increased at each price level. Active demand will stimulate higher prices and expanded output. At the same time, as the price rises, demand activity will fall. This will continue until the system reaches a new equilibrium state E1. The effect obtained from such a shift in the demand curve will be a simultaneous increase in price P1 > P0 and an increase in sales volume Q1 < Q0. A reverse market reaction will be observed when the demand curve shifts down and to the left.
b). Change only non-price factors of supply. For example, the price of raw materials has increased. Production costs will increase. To cover increased costs, manufacturers will increase prices (see Fig. 5.4.5.),
Rice. 5.4.5. Supply Curve Shift Effect
which in turn will lead to a reduction in demand. As a result, a new equilibrium state will arise in the market, characterized by a higher price (P1>P0) and a lower equilibrium quantity (Q10).
The opposite situation will be observed when resource prices decrease.
V). Changes in non-price factors of demand and supply lead to a simultaneous shift in the demand and supply curves, and their influence can be either opposite or unidirectional, i.e. There may be several options. Let's consider one of them, more complex, when, under the influence of non-price factors, demand grows and supply falls, for example, a product has become fashionable, but prices for resources for its production have increased. This situation will lead to the demand curve moving up to the right, and the supply curve up to the left (see Fig. 5.4.6.).
Rice. 5.4.6. The effect of simultaneous shifting of supply and demand curves
Active demand and rising prices for resources will definitely cause an increase in the equilibrium price (P1> P0). The equilibrium quantity can increase, decrease or remain the same (as in our example), it depends on which of the non-price factors is stronger than fashion or resource prices, or whether they balance each other, as in this case (Q0 = Q1).
The ability of the market to return to the lost equilibrium is called the stability of market equilibrium. This means that a change in any factors in the market that causes a disruption of market equilibrium activates forces that ensure the restoration of this state. The stability of market equilibrium is determined by a number of circumstances, but primarily by the type of market structure.
The stability of market equilibrium is an important aspect of theoretical research, since it allows us to solve the most important problem about the degree of government intervention in the course of economic development.
Similar works
- Market equilibrium and equilibrium price
- Market equilibrium and its characteristics (Option 9)
- Market equilibrium (Option No. 9)
- Market equilibrium and its characteristics. Equilibrium price, its change and consequences for the market
- Market equilibrium
- Market equilibrium
- Market and market processes
- Market processes, their place and role in microeconomics
- Market equilibrium (surplus and deficit)
- Market and market processes
- Market equilibrium (supply and demand)
- Market equilibrium
Conditions of occurrence
Market equilibrium does not appear anyhow. Economist L. Walras believed that everything is interconnected: subjects, producers, volume of goods, demand, prices, supply. As a result, the market seems to be “groping” for an equilibrium state. However, Walras never revealed the mechanism of this “groping”.
Francis Edgeworth offered another explanation for the conditions for the onset of economic equilibrium. According to his position, when concluding a deal, all contracts take into account the option of re-concluding it or even terminating it altogether. This happens because the market is not in equilibrium. At equilibrium prices, transactions do not need to be renegotiated, and all previously concluded contracts are paid for. However, the theory of the Irish economist is divorced from life. In reality, no one knows or has complete information about the market, which is why transactions are repeated.
In later theories and concepts, already in the 20th century, the idea arises that the equilibrium of the economic system depends largely on the coordination of economic activity and the dissemination of information. For example, the idea of creating a seventh iPhone appeared. But no one knows about this yet: neither what functions it will have, nor what characteristics it will have.
As a result, there is a surge in expectations and, consequently, wild demand for this product. Therefore, in the first days after the start of sales, you can only buy an iPhone for no less than a hundred dollars. In the future, everyone will find out that there is nothing new in the iPhone and therefore demand decreases, as does the price. So as long as there is no global coordination of economic activity, there will be disequilibrium in the market system. Something like this.
According to modern concepts, market equilibrium is possible by coordinating the activities of the following entities:
- a manufacturer representing a collection of non-financial commercial organizations;
- a bank representing a set of financial commercial organizations;
- the population representing individuals - consumers and employees;
- the owner representing consumers and employees;
- the merchant, as a pure intermediary between consumers, producers, exporters and importers;
- a state whose activities may be represented by the Central Bank;
- exporter;
- importer.
Be that as it may, this is a sensitive topic, and to this day there is no common understanding of equilibrium in the economy. Most likely, this is the same ideal type according to Max Weber as other theoretical constructs. If you have any questions, ask in the comments