- home
- >
- Forex
Bearish Engulfing Candlestick Pattern
) is an uptrend reversal pattern and consists of two candles, the first of which is bullish and the second is bearish. That being said, the length of the body of the first (bullish) candle doesn't really matter, except that it shouldn't be a doji candle since it's relatively easy to get engulfed. It should be followed by a bearish candle with a long body, the longer the body, the higher the potential for a bearish reversal. In this case, the bearish candle should completely cover the body of the bullish candle, and ideally both of its shadows. It should be noted that the presence of shadows is allowed for both candles, but their size should be insignificant relative to the length of their body.
What is a Bearish Engulfing Pattern?
A standard engulfing candlestick pattern is simply a candle that opens at or above the close of the previous candle (almost guaranteed in Forex) and then closes below the open of the same (previous) candle.
Please note that we are talking about real bodies here (see image below).
Note. Some traders consider a bearish engulfing pattern to be one in which the total range (high to low) of the bearish candle also covers the entire range of the previous bullish candle. Others don't take into account real bodies at all.
I have not found this useful in my trading. This article will discuss the price action of the actual bodies (from open to close) of the candles involved in creating this pattern, rather than the full candlestick range.
If you are trading this candlestick pattern outside of Forex, you will likely be dealing with gaps from candle to candle. In such cases, the engulfing candle should gap up and then close lower, as shown in the picture above.
Note. Gaps also sometimes occur in the Forex market. Sometimes a small gap is followed by a bearish engulfing candle.
As long as all other requirements are met, such patterns should be considered valid bearish engulfing signals. In fact, these rare patterns can be especially powerful due to the added technical gap closing pattern.
Additionally, depending on how many gaps occur in the market (not Forex) you are trading, you may see a true bearish engulfing event consisting of two bearish candles in which the second bearish candle closed gap up and engulfed the first (see below). image below).
Finally, this pattern is considered a strong bearish reversal signal. Thus, a true bearish engulfing pattern will only occur after a bullish price move (successive higher highs). Never trade this pattern during a period of price consolidation (flat/sideways price action).
General requirements for absorption figures
The requirements for candles that form engulfing patterns are as follows:
- None of the candles should be "Rainy". These are candles that have almost no body and long shadows.
- The second candle should always be engulfing, and the first candle should always be engulfing. In no case is it the other way around.
- In an ideal formation, both candles should have no shadows (maribozu type), but this option is extremely rare. Therefore, the shorter the length of the shadows, the stronger the pattern.
We also recommend that you familiarize yourself with the information about the indicator for drawing on the Forex chart. It will help you manually mark important candlestick patterns directly on the chart workspace.
Closing confirmation
The first filter is the closing confirmation. I mentioned earlier that one of my own filters is definitely built into the bearish engulfing pattern. This is what I was talking about.
Confirmation of a close is just another clue that the trend is likely to reverse. This occurs in the case of a bearish engulfing pattern when the second candle in the pattern closes below the real body of the first candle (see image above).
Note. This works because the first lower real body in an uptrend is often a signal of an upcoming recovery or reversal—whether or not a price action pattern is involved.
As you can see, the engulfing pattern has its own confirmation candle drawn straight. In the case of the Shooting Star, I will still wait for confirmation because it did not close below the real body of the previous candle.
The principle of “Takeover” trading
For this pattern to work as well as possible, the trader must comply with the following conditions:
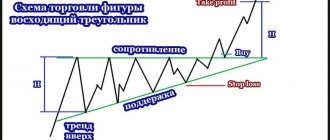
- Before this engulfing pattern appears, there must be an upward or downward movement (trend) . This movement may not be big, but it should be. This condition is mandatory, since “absorption” is a reversal pattern.
- The body of the candle that absorbs should have the opposite color. It is ideal if the shadow is also absorbed. The shadows may not be absorbed, but then the signal will be weaker.
- You always need to take into account the “ market background ” . Before a transaction is opened, you need to analyze this asset. Price history allows us to do this.
Closing relative to a range
The next thing you should consider when trading a bearish engulfing pattern is whether the candle closes at the bottom 1/3 of its range (see image below).
The idea behind this filter is that the long lower wick (sometimes called the shadow) is a technical indicator that can represent a bullish price deviation.
The fact that the price was already lower recently but bounced back could mean that the market is rejecting prices below the pattern's close, making it less likely that bearish force will follow the price lower.
Also, in general, bearish candles that are close to the bottom of their range are considered more bearish. The closer the completion is to the lower end of the range, the better.
Note. When using this filter with other candlestick patterns, remember that it must be applied to the signal candle (or the last candle in a multi-candlestick pattern) as well as the confirmation candle.
Relative pattern size
Also, the significance is given by the size of the bearish engulfing candles, relative to the sizes of the candles that came before it. If you've been trading price action for a while, you've probably heard of this filter before.
In general, larger candlesticks are more significant, so patterns consisting of larger candlesticks are more significant.
Also, the further you have to look to find other candles of the same size, the more significant the candle will be. For example, if your bearish engulfing pattern is larger than the last twenty candles that came before it, the pattern is likely to be significant.
Note. You can still trade bearish engulfing patterns that are slightly smaller than previous candles. However, if you assign points to your trades in a trading journal, you will see a difference between them.
Basically, try to avoid taking price action patterns that are significantly smaller than the previous candles. In such cases, the market says that the pattern is not significant enough to trade.
The relative size filter is applied to both candlesticks and bearish engulfing. In my experience, when these patterns form around a single candle with a small real body, they are not meaningful enough to trade.
Let's sum it up
Today we looked at one of the many models of the Price Action methodology. If you are still conducting indicator trading, then study the price. Let me tell you one little secret, no matter what indicators you use, they will still either lag or be redrawn; if there is a delay, you will lose the risk-to-reward ratio, if you start using signals from drawing instruments, then you will get a good risk-to-reward ratio profits, but at the same time the probability of order execution will greatly decrease. Thus, when trading using indicators, you trade not the price, but the readings of the indicators; the Price Action methodology suggests that you trade the price, and not the readings of the indicators.
Trading using candlestick patterns has a number of huge advantages, firstly, the absence of redrawing, secondly, the absence of lag, and thirdly, the highest possible risk-to-profit ratio. Using this technique with conventional graphical analysis, you are sure to achieve excellent results.
And finally, let’s imagine a situation where all the indicators have disappeared from the market, in which case the price will still remain, and now imagine the opposite situation, if the price disappears from the market, in which case the indicators will also disappear, so the price plays a more important role than any most advanced algorithmic tool.
Trading the Bearish Engulfing Candlestick Pattern
Assuming your bearish engulfing pattern has passed all of the above filters, now it's time to actually place and manage your trade. Of course, you will want to backtest and demo trade these methods before attempting them on a live account.
Entrance
The first thing I want to discuss is where you should actually place your entry when trading a bearish Engulfing pattern. There are several methods you can use, but I recommend using only the two standard inputs and the 50% input.
In most cases you will use one of the standard inputs. The 50% entry is only used in certain situations, which I will detail below.
Standard inputs
The first standard technique for entering a bearish engulfing pattern is to simply place a sell order at the open of the next candle (see image below - left). Of the two standard entries, this is my preferred method because it creates a more favorable risk/reward scenario.
The next standard entry method is to wait for a break of the low of the engulfing candle. In the Forex market, your entry will be 1 pip below the low (see image above - right).
Whenever possible, you should use a sell stop order to enter the market using the second standard entry. This will ensure that you get an accurate entry, and it will allow you to avoid looking at the screen waiting for a breakout of the lower level.
50% entry
This next entry should only be used when standard entries would result in a bad risk/reward scenario (which I'll talk more about later).
A high upper wick or high engulfing candle means you will be risking more pips.
Higher risk means you are less likely to hit your take profit because some of the reversals you were hoping for are already taken by the high wick or candle. This also means that your take should be larger (in points or pips), which further reduces the likelihood of it getting triggered.
In principle, both cases give a bad RR relationship scenario.
The solution is to look for price improvement. This occurs when the next candle reaches 50% of the entire range of the engulfing candle (see image above).
If there is a pullback, I get a much better entry and the chances of my take getting triggered increases.
Note. When using this method, you may miss some trades because the price will not always return to your entry.
This is fine for me because I only want to execute high quality trades that will provide a real edge in the market (quality over quantity).
Whenever possible, you should use a sell limit order to make a 50% entry. Again, this will help you get an accurate entry and won't leave you staring at the screen waiting for a bounce.
Stop Loss
Now we will touch on the topic of where to place a stop loss when trading a bearish engulfing pattern, and when to move it to the breakeven point (optional).
You always want to place a stop loss in the closest area where you know that if the price hits it, you were wrong about the pattern. In a bearish pattern, you know you are wrong if the price makes a new high.
In the Forex market, you pay a spread when you exit a sale, so you should add the spread to your stop loss. If you don't do this, you may get thrown out of the trade before the price actually breaks the high.
A good rule of thumb is to place your stop loss 5 pips above the high of your pattern (see image below). This will provide plenty of room for your average spread, plus a few pips above the maximum in case the spread widens slightly.
Note. On the daily chart, you should place your stop 5-10 pips above the high, which will make trading on the daily chart a little easier.
Just in case, after the price has moved a little in your favor, you can move your stop loss to breakeven. This method is optional, although I personally use and recommend it.
I move my stop losses to breakeven plus 2 - 3 pips (depending on the pair) to cover the spread once the price reaches 60% of my target take profit.
In other words, if my take profit is 100 pips, I move my stop loss to breakeven plus 2 - 3 pips after the trade has moved 62-63 pips in my favor.
Why 60% and not 50% (or 1:1 reward to risk)? Often the price will move back to the entry or even higher when the 50% (or 1:1) target has already been reached (see image above).
Note: Market makers do this to increase their positions before continuing downward because they know that many traders place their stops at breakeven at 1:1.
If you are using the MetaTrader 4 platform, you can use this breakeven indicator, which will automatically move your. This way, you won't have to sit in front of your computer screen.
Take Profit
When trading price action patterns, I use different takes from time to time based on what type of trade I am trading and the risk to reward ratio they provide. For example, I typically target a 3:1 reward to risk ratio when trading Harami patterns.
However, when trading most other price action patterns, including bearish engulfing, I aim for a 2:1 reward to risk ratio.
This means that if I risk 50 pips, I place my take 100 pips from my entry (see image above). This relationship pattern has performed well over the years, especially in bearish engulfing patterns.
Note. Some trading systems do not use set take profit levels. Instead, they use some form of trailing stop in an attempt to catch as much of a trend or reversal as possible.
In my experience, I can target a 2:1 reward to risk ratio and achieve a high enough take rate (by combining all of this with a good trading system or additional techniques (below)) to achieve consistent long-term profits.
Opening a deal
Stop losses and the “absorption” model
When trading this pattern, you must understand your stop. In principle, the success of trading will depend on this. Stop installation methods:
- Setting a stop beyond the extremum of the signal candle. Not far, within a few points.
- Stop according to the ATR indicator. The ATR value is doubled and the stop is set to the resulting number of points.
Approximate placement of a stop in an engulfing model. Attention! Consider the market background.
Bonus: Combination of Methods
Those of you who have already read my articles probably remember that I do not trade just one price action. I use a much better system with more consistent profits by combining price action models with other free trading strategies.
If you are unable to use these price action patterns as entry triggers in an already profitable trading system, then they are best combined with the methods below.
Resistance levels
You've probably heard that combining price action with support and resistance can be a very profitable combination. This is true if you choose good levels to trade.
When trading a bearish engulfing pattern, the idea is to scan the chart on the left to any previous structure that may be acting as resistance.
For a resistance level to be considered good, there must be a good spike at it, as well as a good bounce down from the level. There should also be no other competing higher resistance levels.
It helps to remember that support and resistance act as zones rather than precise price levels. At the same time, we should always draw support and resistance levels from real candle bodies, not wicks (see image above).
Once you have established a good resistance level, watch for bearish price action signals, such as a bearish engulfing pattern, forming at or near the level.
I like to see at least a wick from the candles involved in the pattern that touches the resistance level. However, the best setups occur when a Bearish Engulfing breaks a level and then returns because this is often a sign that market makers are breaking traders' stops to create a reversal (see chart above).
Note. For a detailed guide on choosing optimal support and resistance levels please follow this link.
Bearish divergence
I love trading divergences. The first trading system that worked for me used stochastic divergences for setups, and even today I still look for divergences. I especially like to trade MACD divergence.
Bearish MACD divergence occurs during an uptrend when price makes higher highs while the MACD line or histogram (pictured below) makes lower highs.
The idea is that lower highs on the MACD line or histogram can be an early indicator that momentum is leaving the uptrend, increasing the likelihood of a reversal. When combined with a strong bearish reversal signal, such as a bearish engulfing, the chances of a reversal are even better.
In divergence setups like this, the divergence is actually the key signal. A bearish engulfing pattern, or other bearish candlestick pattern, is used only to laser target your entry.
Note. To trade MACD divergence correctly, you must ensure that you are using the correct MACD indicator. By default, this indicator in the MetaTrader 4 platform and many other platforms does not work as it should...
Divergence trading strategies other than MACD divergence will also work well with most price action patterns. In fact, as an additional filter, many divergence traders like to wait for multiple indicators to diverge before entering a trade.
What absorptions should you pay attention to?
Identifying work takeovers is not that difficult. It would be logical to explain Bullish and Bearish Engulfing as follows.
In the case of a bullish engulfing : at some point, the buyers turned out to be so much stronger than the sellers that they were able to block the previous candle of the short sellers. This does indicate the power of buyers, but shouldn't we be getting scammed at this point? Maybe the market maker needs new victims and, taking advantage of the ignorance of most traders, such a lure appears on the chart? These questions do exist, the major player is very strong and is capable of pulling off such an offer, but we should not get caught in this, at least we need to identify places with the maximum expected value in our favor. So where can we find such a place?
I think you have already answered this question. At the levels of resistance and support, this is where we get the highest expectation in our direction, and if we are unlucky and have to catch a stop loss, then nothing bad will happen, future typical transactions will more than pay for everything.
Two important factors to consider
- Strong impulse in a significant area.
- Strong price rebound.
If you are buying from support, do you prefer the nearest price high to be close or far away? You'll likely prefer it to be far away so your trade has more profit potential (before selling pressure sets in).
However, if you see a stepwise price decline on the chart that hits support, the market will likely continue to experience selling pressure:
Not all bullish engulfing patterns are created equal. As shown earlier, a bullish engulfing pattern is usually a retracement against a downtrend (on a lower time frame). This is especially true if the size of the candles is small or similar to the size of previous candles.
But if the range of the bullish engulfing pattern is greater than the earlier candles, it signals strong buying pressure. Additionally, if you look at a lower time frame, you will likely see a breakout in the market structure as price makes higher highs and higher lows (another sign of strength from buyers).
External Bar Indicator for MT4
At first, beginners may find it useful to use the auxiliary indicator for the MetaTrader 4 terminal, which determines the setup on the chart for you (without taking into account levels and other nuances), and also gives profit taking levels and stop loss settings.
The indicator is installed according to standard instructions.
Stop to profit ratio.
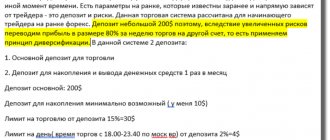
There are several options when you need to take profits. An open transaction must have positive mathematical expectations. This is the only way a trader can make money.
Video on risks in trading
The ratio is 1 to 2, 1 to 3 and so on. In this case, the trader has a positive expectation. But a fixed profit does not always fit into market conditions. The price moves from level to level. This means that profit can be recorded near these levels. Having determined the levels in advance, it will immediately be clear what the potential of the transaction is (ratio) 1 to 1, 1 to 2 or more. If you can’t take a ratio of at least 1 to 2, you should think about opening this trade. But when the decision is made to open a trade, this should be done with a reduced volume.
I offer a great mutually beneficial deal
I have great free video lessons:
- About a major player
- About market mechanics
- About levels
Subscribe to our newsletter
It takes half a minute to subscribe and immediately after subscribing you receive an email with a link to the lessons.
Summary of the “Absorption” Price Action model.
Absorption, like all other reversal Price Action models, works in the context of the market . A trader should not be paranoid about this and other patterns on his chart. You need to correctly find levels and zones where there may be a reversal. And already use absorption and other PA models as confirmation of your actions. Be it buying or selling an asset.
This article is material from the “ABC of Trading” . Look into it. There is still a lot of interesting things there!
Difficult? “Trading for Dummies” – free market training.
Subscribe to our telegram channel and get the best information.