We continue to study important stock valuation ratios. Today we will analyze a new indicator using the example of the very popular company Tesla.
Investors are always looking for ways to analyze stock prices. The P/S (price to sales ratio) indicator is often used for this purpose. To determine whether a stock is properly priced, the market capitalization and the company's revenue are compared.
This ratio is widely used because it places a company's valuation in the context of one of the easiest financial metrics to understand—revenue.
Formula for calculating P/S
Let's look at what the P/S ratio shows and what formulas exist for calculating the balance sheet.
Option #1. The formula for calculating the P/S multiplier is as follows and obvious:
Capitalization is the value of all issued shares on the company's stock market. It can be found on the official websites of companies, on the MICEX exchange or in the Tradingview service.
Revenue is the volume of sales of products (services). Reflected as line 2110 in the “Income Statement”.
Option #2. Variation of calculating the coefficient using return on sales:
Shows a direct relationship between ROS - return on sales and the P/E multiplier (Capitalization / Net profit).
Advantages of using the “Revenue” criterion in P/S
One of the advantages of P/S in relation to other indicators (for example P/E) is the use of revenue as the denominator. Its use reflects:
- A measure of the company's influence . Using revenue in ratio calculations as an overall performance indicator reflects how dominant a company is in its industry and how much cash it receives from sales.
- Potential for growth . Revenue is the amount of money a company received from sales. If we use net income, we exclude the impact of costs on production costs, management and operating expenses. As profitability increases and costs decrease, revenue becomes a potential driver of net profit.
Additional drivers for market value growth
There are additional factors influencing the growth of undervalued stocks:
Investment projects . Expanding the capacity of enterprises, construction, and implementation of investment projects leads to an increase in the assets of the enterprise and its internal value.
Growth of financial ratios . An increase in the value of key financial ratios (net profit, profitability, turnover, financial stability, liquidity) leads to increased interest among investors in the company's shares. Financial indicators are reflected in quarterly reports. If the indicators turn out to be many times better than predicted, this leads to an increase in prices on the stock market.
Mergers and acquisitions . A company's reorganization changes its capital structure and the size of its assets, resulting in an increase in its intrinsic value.
Amortization. Reducing the debt burden improves the company's financial performance and increases its attractiveness.
Expectation and size of dividends . The announcement of dividend payments attracts investors to receive them and creates “dividend rallies.” The larger the payment, the more people want to receive payments and the greater the price increase before the cut-off date.
Warren Buffett's portfolio
Let's look at Buffett's portfolio as a representative of the school of value investing at the moment ↓
You can view the composition of W. Buffett’s portfolio on the website finbox.io
You can see that he invests in companies that are leaders in their segment. At the moment, he still added a share of an IT company (Apple), which is very overvalued and has a P/E = 24.5. It takes up more than 30% of his portfolio!
His portfolio is built on the following principles, which expand on Graham's approach:
- Investing in companies that are “understandable” for investors. For example, Coca-Cola - because he likes to drink it.
- Return on equity and net profit margin are high.
- The company must continually grow in profit.
- The company has the potential to grow and scale in its sector.
- The owners of the company have a positive reputation.
Standard P/S value
The key task of the indicator is to find those companies that are undervalued by the market and have potential for future growth. The higher the P/S value, the worse it is for the investor, because he has to pay more for every 1 unit of revenue.
| Meaning | Attractiveness |
| P/S < 1 | The company is undervalued and has potential for growth |
| 1 < P/S < 2 | The company is optimally valued by the market |
| P/S > 2 | The company is overvalued by the market |
| P/S1 2 | Company (1) is more investment attractive than (2) |
| P/S1 * | The company's P/S is less than the market average (*) The company can be purchased (absorbed) due to low capitalization |
There are no exact standards in the capital market; they are all advisory in nature. For example, Apple (AAPL) P/S >3. And despite its overvaluation, it still tends to grow.
Relationship between P/S and the stage of development of the company
The dynamics of the P/S ratio reflects the stage of development of the company . Changes in revenue show the stages of development: growth, stagnation, decline. In the growth phase, revenue volumes will decrease, and vice versa, when revenue decreases, the ratio will increase.
| Dynamics of P/S | Company development phase |
| P/S ↓ | Growth phase. The company increases sales, influence and dominance in its industry |
| P/S ↑ | Phase of decline or stagnation. The company reduces sales volumes, decreases market influence, decreases competitiveness |
Standard & Poor's short-term credit rating scale
Short-term ratings show the issuer's creditworthiness over a 12-month period.
- A-1 – the highest level;
- A-2 – high level, there is sensitivity to economic changes;
- A-3 – economic instability can undermine the creditworthiness of the issuer;
- B – speculative level, the issuer is solvent, but is especially sensitive to the economic situation;
- C – solvency is limited, strong dependence on market conditions;
- D – the issuer is in default.
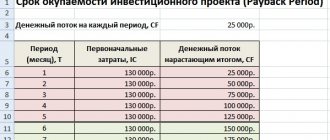
A practical example of calculating P/S for PJSC Gazprom
For a deeper understanding, consider a practical example of calculating the P/S multiplier for PJSC Gazmrom (GAZP). At the first stage, we calculate the company's capitalization. To do this, go to the Moscow Exchange → enter the ticker of the company “GAZP” in the search bar → the company’s card shows the size of capitalization.
Where to find the size of a company's capitalization on the domestic stock market (MICEX)
The second way to determine capitalization using the TradingViews service → go to the service.
Assess the size of a company's capitalization using the TradingView service
To calculate revenue, you need to use Gazprom’s quarterly financial statements from the official website. Reports by quarter and year can be viewed here → reporting. Revenue is reflected in the “Income Statement” as the first line (code 2110).
Final value P/S = 4609000 / 10858916 million rubles. = 0,42
This value signals that the stock is severely undervalued.
In the calculations, I used revenue data for 2021, because... There are no reports for the 1st quarter yet.
TOP countries with high Standard & Poor's ratings
11 countries have the highest long-term credit rating S&P (AAA) in foreign currency (as of 2021). Many of them have huge foreign debts, but are considered highly reliable because, even though they borrow a lot, they repay them on time (debt in $ in parentheses).
North America:
- Canada (1.6 trillion).
Australia and Oceania:
- Australia (1.5 trillion).
Asia:
- Singapore (633 billion).
Europe:
- Germany (2.56 trillion);
- Switzerland (1.84 trillion);
- Sweden (910 billion);
- Norway (615 billion);
- Netherlands (513 billion);
- Denmark (109 billion);
- Luxembourg (16.14 billion);
- Liechtenstein (0).
Interesting fact: S&P is the only representative of the Big Three on whose scale the United States does not have the maximum credit rating.
In the author’s article “Creditors or to whom the world’s population owes $244 trillion,” you will become familiar with the reasons for the emergence of huge external debt.
Table of countries by size of external debt.
| № | State | National currency (Ticker) | External debt ($ billion) | External debt ($) per capita | External debt to GDP in % | |
| 1 | Austria | Euro (EUR) | ECB | $345.9 billion | $98.7 thousand | 194% |
| 2 | Belgium | $566.4 billion | $136.2 thousand | 338% | ||
| 3 | Germany | $2.557 trillion. | $31.4 thousand | 71% | ||
| 4 | Greece | $589.6 billion | $52.7 thousand | 234% | ||
| 5 | Ireland | $2.747 trillion. | $542.1 thousand | 737% | ||
| 6 | Spain | $1.849 trillion. | $8 thousand | 137% | ||
| 7 | Italy | $3.16 trillion. | $52.66 thousand | 144% | ||
| 8 | Cyprus | $95.2 billion | $81.2 thousand | 107% | ||
| 9 | Latvia | $39.8 billion | $18.4 thousand | 131% | ||
| 10 | Lithuania | $29.5 billion | $8.4 thousand | 63% | ||
| 11 | Luxembourg | $16.14 billion | $4.55 million | 3600% | ||
| 12 | Malta | $46.2 billion | $112 thousand | 496% | ||
| 13 | Netherlands | $515.3 billion | $29.99 thousand | 64% | ||
| 14 | Portugal | $452.4 billion | $43.7 thousand | 190% | ||
| 15 | Slovakia | $68.4 billion | $12.5 thousand | 70% | ||
| 16 | Slovenia | $53.9 billion | $27.1 thousand | 115% | ||
| 17 | Finland | $158.6 billion | $111.3 thousand | 266% | ||
| 18 | France | $6.266 trillion. | $32 thousand | 98% | ||
| 19 | Montenegro | $650 million | $939 | 24% | ||
| 20 | Estonia | $26.7 billion | $21.2 thousand | 110% | ||
| 21 | Albania | Albanian Lek (ALL) | Bank of Albania | $1.55 billion | $ 497 | 21% |
| 21 | Belarus | Belarusian ruble (BYN) | NBB | $38.6 billion | $4 thousand | 79% |
| 22 | Bulgaria | Bulgarian Lev (BGN) | BNB | $37.8 billion | $5.4 thousand | 70% |
| 23 | Great Britain | pound sterling (GBP) | Bank of England | $2.681 trillion. | $119 thousand | 108% |
| 24 | Hungary | Hungarian Forint (HUF) | National Library of Hungary | $170.3 billion | $17.1 thousand | 130% |
| 25 | Denmark | Danish krone (DKK) | National Library of Denmark | $109.1 billion | $105.3 thousand | 244% |
| 26 | Iceland | Icelandic krona (ISK) | Central Bank of Iceland | $102 billion | $321.4 thousand | 699% |
| 27 | Moldova | Moldovan Leu (MDL) | National Library of Moldova | $3.9 billion | $1.1 thousand | 73% |
| 28 | Norway | Norwegian krone (NOK) | Norwegian bank | $614.8 billion | $139.8 thousand | 201% |
| 29 | Poland | Polish zloty (PLN) | National Library of Poland | $352.3 billion | $9.5 thousand | 71% |
| 30 | Romania | Romanian leu (RON) | National Library of Romania | $130.4 billion | $6 thousand | 71% |
| 31 | Russia | Russian ruble RUB | Bank of Russia | $453.75 billion | $3 thousand | 36% |
| 32 | Ukraine | Hryvnia (UAH) | NBU | $78.3 billion | $1.8 thousand | 63% |
| 33 | Czech | Czech crown (CZK) | National Library of the Czech Republic | $103.2 billion | $9.7 thousand | 52% |
| 34 | Croatia | Croatian Kuna (HRK) | Croatian NB | $63.3 billion | $14.1 thousand | 108% |
| 35 | Sweden | Swedish krona (SEK) | Bank of Sweden | $910 billion | $16 thousand | 18% |
| 36 | Switzerland | Swiss franc (CHF) | National Library of Switzerland | $1.844 trillion. | $191.5 thousand | 27% |
| Oceania | ||||||
| 37 | Australia | Australian dollar (AUD) | RB Australia | $1.486 trillion. | $66.9 thousand | 151% |
| 38 | New Zealand | New Zealand dollar (NZD) | RB NZ | $81.3 billion | $18.4 thousand | 45% |
| Asia | ||||||
| 39 | Azerbaijan | Azerbaijani manat (AZN) | Central Bank of Azerbaijan | $6.0 billion | $647 | 8% |
| 40 | Armenia | Armenian dram (AMD) | Central Bank of Armenia | $8.6 billion | $2.9 thousand | 75% |
| 41 | Vietnam | Vietnamese dong (VND) | GB of Vietnam | $68.3 billion | $732 | 40% |
| 42 | Hong Kong | Hong Kong dollar (HKD) | Hong Kong parole | $1.63 trillion. | $155.9 thousand | 290% |
| 43 | Georgia | Lari (GEL) | National Library of Georgia | $14.1 billion | $3.7 thousand | 90% |
| 44 | Israel | Shekel (ILS) | Bank of Israel | $96.3 billion | $12.3 thousand | 35% |
| 45 | India | Indian Rupee (INR) | RB India | $550 billion | $423 | 27% |
| 46 | Indonesia | Indonesian Rupiah (IDR) | Bank Indonesia | $223.8 billion | $882 | 26% |
| 47 | Iraq | Iraqi Dinar (IQD) | Central Bank of Iraq | $59.5 billion | $1.8 thousand | 27% |
| 48 | Iran | Iranian rial (IRR) | Central Bank of Iran | $15.6 billion | $193 | 4% |
| 49 | Kazakhstan | Tenge (KZT) | NB RK | $161.4 billion | $9.1 thousand | 94% |
| 50 | Kyrgyzstan | Som (KGS) | NB KR | $3.7 billion | $600 | 54% |
| 51 | China | Chinese Yuan (CNY) | National Bank of China | $1.607 trillion. | $1.15 thousand | 14% |
| 52 | Kuwait | Kuwaiti Dinar (KWD) | Central Bank of Kuwait | $34.4 billion | $12.5 thousand | 19% |
| 53 | Malaysia | Malaysian ringgit (MYR) | BNM | $100.1 billion | $3.3 thousand | 32% |
| 54 | UAE | UAE Dirham (AED) | Central Bank of the UAE | $163.8 billion | $24.2 thousand | 41% |
| 55 | Pakistan | Pakistani Rupee (PKR) | GB of Pakistan | $66.4 billion | $346 | 22% |
| 56 | The Republic of Korea | South Korean won (KRW) | Bank of South Korea | $430.9 billion | $8.7 thousand | 36% |
| 57 | Saudi Arabia | Saudi Riyal (SAR) | ADO SA | $149.4 billion | $5.4 thousand | 20% |
| 58 | Singapore | Singapore dollar (SGD) | DKUS | $632.6 billion | $210.8 thousand | 346% |
| 59 | Tajikistan | Somoni (TJS) | National Library of Tajikistan | $2.1 billion | $270 | 28% |
| 60 | Thailand | Thai baht (THB) | Bank of Thailand | $86.1 billion | $1.2 thousand | 21% |
| 61 | Turkmenistan | New Turkmen manat (TMT) | Central Bank of Turkmenistan | $5.0 billion | $934 | 31% |
| 62 | Türkiye | Turkish lira (TRY) | Central Bank of TR | $685.2 billion | $4.4 thousand | 44% |
| 63 | Uzbekistan | Uzbek sum (UZS) | Central Bank of the Republic of Uzbekistan | $17.3 billion | $520 | 33% |
| 64 | Philippines | Philippine Peso (PHP) | Central Bank of the Philippines | $72.8 thousand | $676 | 27% |
| 65 | Sri Lanka | Sri Lankan Rupee (LKR) | CB SHL | $1.2 thousand | $42 | 66% |
| 66 | Japan | Japanese Yen (JPY) | Bank of Japan | $13.5 trillion. | $76.8 thousand | 295% |
| North America | ||||||
| 67 | Dominican Republic | Dominican Peso (DOP) | Central Bank of the DR | $18 billion | $1.7 thousand | 30% |
| 68 | Canada | Canadian dollar (CAD) | Bank of Canada | $1.613 trillion. | $38.2 thousand | 88% |
| 69 | Cuba | Cuban Peso (CUP) | Central Bank of Cuba | $23.4 billion | $2.1 thousand | 32% |
| 70 | Mexico | Mexican Peso (MXN) | Bank of Mexico | $1.444 trillion. | $10.7 thousand | 27% |
| 71 | Panama | Balboa (PAB) | NB of Panama | $15.2 billion | $4.2 thousand | 37% |
| 72 | USA | US dollar (USD) | Fed | $23.14 trillion. | $69.6 thousand | 135% |
| South America | ||||||
| 73 | Argentina | Argentine Peso (ARS) | Central Bank of Azerbaijan | $111.5 billion | $2.5 thousand | 23% |
| 74 | Brazil | Brazilian real (BRL) | Central Bank of Brazil | $3.195 trillion. | $2.3 thousand | 122% |
| 75 | Chile | Chilean Peso (CLP) | Central Bank of Chile | $119 billion | $6.8 thousand | 42% |
| Africa | ||||||
| 76 | Algeria | Algerian Dinar (DZD) | Bank of Algiers | $3.4 billion | $97 | 2% |
| 77 | Egypt | Egyptian pound (EGP) | Central Bank of Egypt | $48.7 billion | $561 | 19% |
| 78 | Morocco | Moroccan Dirham (MAD) | Bank of Morocco | $36.5 billion | $1.1 thousand | 35% |
| 79 | Nigeria | Naira (NGN) | Central Bank of Nigeria | $15.7 billion | $89 | 5% |
| 80 | Tunisia | Tunisian Dinar (TND) | Central Bank of Tunisia | $26.9 billion | $2.4 thousand | 56% |
| 81 | South Africa | South African rand (ZAR) | SARB | $139 billion | $2.8 thousand | 39% |
[Service] Where to quickly view P/S for foreign shares
In order to find shares of foreign companies, we will use the service finviz.com → Screener. Go to the “Screener” section → “Fundamental indicators” → “Filter <1”. The figure shows the stages of working with the service to find undervalued stocks. Further analysis can be aimed at assessing the attractiveness of other company indicators P/E, P/B, P/C, current ratio, quick ratio, profitability (ROA, ROE, ROI).
Step-by-step instructions on how to estimate P/S for foreign stocks using the Finviz service
Credit rating of Russia from Standard & Poor's
- BBB- – long-term credit rating of Russia in foreign currency;
- BBB – long-term credit rating of Russia in local currency;
- A3 – short-term credit rating of Russia in foreign currency;
- A2 – short-term credit rating of Russia in local currency
S&P evaluates the credit rating of the Russian Federation as follows:
- long-term in foreign currency - the lower level of investment grade, under threat of being downgraded by one level if the economic situation changes;
- long-term in local currency - lower level of investment grade
- short-term in foreign currency - the lower level of investment grade;
- short-term in local currency – high level, but there are risks if the economic situation worsens;
(+ / –) Advantages and disadvantages of P/S
Let's look at the advantages and disadvantages of using the P/S ratio.
(+) Difficulty in manipulation . The revenue indicator that is included in the calculation formula is difficult to fake in financial statements (than net profit). It does not depend on accounting policies and directly reflects the company's performance. P/S manipulation option. One of the options for influencing the ratio is the use of share repurchases in order to increase market value.
(+) A unified form for comparing all companies . The ability to compare different companies, regardless of their industry, stage of development and size. Comparing companies by absolute values of fundamental indicators: net profit, revenue, size of assets, debt, etc. we would not be able to compare businesses due to the volatility of these indicators and their absolute values.
(+) Versatility in calculations . The ratio can always be calculated for any financial statements of the company. Since the denominator is revenue, which is always there, in contrast to net profit, which in some periods may be negative or equal to zero. This is an advantage over the P/E multiplier, which can take negative values in some periods (calculated as the ratio of the share price to net income).
(–) Large revenues may hide small profits . A company may receive a lot of revenue, but not have a net profit, which can be spent on expenses, costs, fees and taxes. Focusing only on this indicator will not provide complete information about the company.
Value Investing Tools
In order to find an undervalued company, you need to have tools for quick monitoring and search. A number of coefficients, so-called “multipliers”, have been developed that solve this problem. The multiplier is the ratio of the market value of a company (or its value) to production or financial indicators and allows you to compare different similar companies with each other.
Let's look at 10 useful multiples that can be used to evaluate American and Russian stocks. Each of them has its own characteristics, advantages and limitations.
- P/E
- P.E.G.
- P/CF
- P/B
- D/E
- EV/EBITDA
- EV/S
- ROE
- ROA
- DPR
Recommendations for use
A number of additional recommendations for using the multiplier:
- The P/S ratio reflects the undervaluation of the stock.
- It is better to compare companies of the same industry and segment. You cannot compare companies with high and low capital intensity: for example, Gazprom and Yandex.
- It is better to use the P/S indicator in conjunction with other multipliers (P/E, ROE, P/BV, EPS, Debt/EBITDA, EV/EBITDA, EBITDA.
- Poorly suited for assessing insurance and financial companies due to the peculiarities of revenue generation. Aswath Damodaran recommends use for the telecommunications industry.
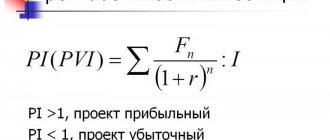
| Business valuation | Financial analysis according to IFRS | Financial analysis according to RAS |
| Calculation of NPV, IRR in Excel | Valuation of stocks and bonds |
Credit rating of Kazakhstan from Standard & Poor's
- BBB- – long-term credit rating of Kazakhstan in foreign and local currency;
- A-3 – short-term credit rating of Kazakhstan in foreign and local currency.
S&P's assessment of Kazakhstan's long-term foreign and local currency credit rating is similar to Russia's foreign currency rating, and its short-term multi-currency rating is similar to Russia's foreign currency rating.
That is, S&P considers the solvency of Russia and Kazakhstan in foreign currencies to be the same, but in local currencies, Russia is one level higher.
When does a value investing strategy work?
The value investing strategy shows itself 100% during a crisis. During periods of crisis, stocks sell off because money and cash become more of a priority. Fall during a crisis, as a rule, affects all companies, small and large. As a result, the value on the market turns out to be less than the value of the property they reflect.
A crisis is a great time to invest and sometimes a win-win strategy. It is during a crisis that multi-billion dollar capitals are created.
Stages of development
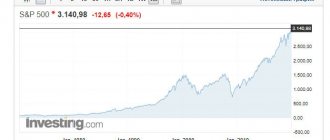
Standard & Poor's first introduced the S&P 500 to the world in 1957. Over the past 50 years, it has grown from 89.5 to 3,335.47 points (as of September 30, 2020). But the history of development began long before 1957:
- 1923 – An index of 233 stocks representing 26 industries was created. It was difficult to track changes on a daily basis.
- 1926 - The Standard Statistics index appeared, which included 90 securities: 50 industrial, 20 railroad and 20 utility companies. For the first time, its values began to be updated daily.
- 1941 – Standard & Poor's creates an index based on 416 stocks from 72 industries. But the S&P 90 also remained, although it consisted of 100 items.
- 1957 - The S&P 500 combined the two previous indices and began to exist in the form we know. This unification became possible thanks to the development of computer technology and automation of the calculation process. The structure was as follows: 425 industrial, 60 municipal and 15 railway enterprises.
- 1976 – the structure changed: 400 industrial, 40 utility, 40 financial and 20 transport enterprises. For the first time, securities of financial companies were included in the list.
Anywhere in the world you can monitor changes in the S&P 500 online on an interactive chart. Hundreds of websites publish its dynamics. By ups and downs, you can track the dates of global financial crises and periods of economic recovery. Over the past 50 years, the graph looks like this: