Beta coefficient. Definition
Beta coefficient (English: Beta, β, beta coefficient) – determines the measure of risk of a stock (asset) in relation to the market and shows the sensitivity of changes in the stock’s profitability in relation to changes in the market’s profitability. Beta can be calculated not only for an individual stock, but also for an investment portfolio. The coefficient is used as a measure of systematic risk, and is used in the W. Sharpe model - the valuation of capital assets CAPM (Capital Assets Price Model). First, the beta coefficient was considered by G. Markowitz to assess the systematic risk of stocks, which was called the non-diversifiable risk index. The beta coefficient allows you to compare shares of different companies with each other based on their degree of risk.
Take our proprietary course on choosing stocks on the stock market → training course
Take our proprietary course on choosing stocks on the stock market → training course
Investment portfolio beta
Previously, we talked about the beta of an individual asset. But if we talk about the beta of the investment portfolio, then the picture is a little different.
Modern portfolio theory assumes that the market is efficient: all information is immediately included in the stock price, and no one market participant can gain an advantage over another. Therefore, the only way to achieve returns above the market is to take on more risk.
And here’s another interesting article: Trading, active and passive investing – what is it and how do they differ?
The beta of the portfolio shows exactly what risk an investor is willing to accept. If the beta of the portfolio is greater than one, then it (the portfolio) will be more profitable, but during a crisis it will fail more than the index. If beta is less than 1, then the investor will receive less income, but his portfolio will behave more stable during a crisis.
Therefore, the essence of portfolio investing is to assemble a portfolio with a beta that would suit the investor.
For conservative investors, a beta equal to 1 or even less than 1 is enough. And for aggressive investors, give a larger and fatter beta)))
What would the portfolio beta formula look like? The essence is the same as for one stock, but we have several assets in the portfolio, so we need to take into account their weights. It's logical. If a portfolio is 95% stocks and 5% bonds, then bonds will contribute little to stabilizing beta.
Therefore, the beta of a portfolio is simply the sum of the betas of the individual assets with a modifier for their weights:
Here:
- Вр – beta of the entire portfolio;
- Bn – beta of the nth stock;
- W – share weight;
- n – number of elements (stocks) in the portfolio.
The expected return of a portfolio can also be expressed in terms of beta. To do this, use the following formula:
Here:
- Ep – expected profitability;
- Er – market (index) return.
In the course “How to build your investment portfolio,” I explain in detail how you can calculate beta yourself, where you can find ready-made calculations of alpha and beta coefficients for individual assets, and most importantly: how to use automated services to create a portfolio with optimal beta and other multipliers (for example , Sharpe ratio). If you are a fan of index investing, this information will be invaluable to you.
So, beta is a coefficient that measures the volatility of an asset in relation to an index (benchmark). Beta is calculated both for an individual security and for the entire portfolio as a whole. Conservative investors are better off choosing stocks and putting together portfolios with a beta close to 1. And aggressive ones can take risks. Good luck, and may the money be with you!
Rate this article
[Total votes: 2 Average rating: 5]
Beta Calculation Formula
Where:
β – beta coefficient, a measure of systematic risk (market risk);
ri – profitability of the i-th acacia (investment portfolio);
rm – market return;
σ2m – dispersion of market returns.
| ★ Excel spreadsheet for creating an investment portfolio of securities (calculate the portfolio in 1 minute) + assessment of risk and return |
| ★ InvestRatio program - calculation of all investment ratios in Excel in 5 minutes (calculation of Sharpe, Sortino, Treynor, Kalmar, Modiglanca beta, VaR ratios) + forecasting rate movements |
Sortino coefficient
The Sortino ratio, like the Sharpe ratio, characterizes the efficiency of fund management in terms of the combination of profitability and risk. But the calculation of risk here is not based on all fluctuations in the fund's results relative to the average return (standard deviation), but only on negative fluctuations.
The formula for calculating the Sortino coefficient over a period of 3 years:
Sortino Ratio = ( y – r)/36/ σ' ,
where y is the value of the fund’s return for the 36 months preceding the calculation date;
r – interest rate on deposits in rubles for the population for 36 months (risk-free asset rate);
σ' – standard deviation (volatility) of the fund’s negative return for 36 months. Data on positive fund returns are excluded from the calculation base.
Analysis of the risk level by the value of the beta coefficient (β)
Take our proprietary course on choosing stocks on the stock market → training course
Beta measures the market risk of a stock and reflects the sensitivity of a stock's changes to changes in market returns. The table below shows the risk level estimate based on beta. Beta can have either a positive or negative sign, which shows a positive or negative correlation between a stock and the market. A positive sign reflects that the returns of stocks and the market are moving in the same direction, a negative sign – movement in different directions.
| Indicator value | Share risk level | Direction of change in stock returns |
| β > 1 | High | Unidirectional |
| β = 1 | Moderate | Unidirectional |
| 0 < β < 1 | Short | Unidirectional |
| -1 < β < 0 | Short | Multidirectional |
| β = -1 | Moderate | Multidirectional |
| β < -1 | High | Multidirectional |
The article provides a description of the beta coefficient and beta-neutral (market-neutral) investment portfolio. Continues the series of publications on the application of methods of probability theory and mathematical statistics to transactions with securities and other financial assets.
CONTENT:
1. Security Beta 2. Calculating Stock Beta Example 3. Beta and Security Portfolio Risk 4. Calculating Stock Portfolio Beta Example 5. Beta-Neutral Portfolio and Pairs Trading Notes and References Abbreviations Used
1. BETA RATIO OF A SECURITY
At the end of the last century, the American economist, winner of the 1990 Nobel Prize in Economics, William Forsyth Sharpe, made the assumption of a linear relationship between the average market return (stock index return) and the return on an individual security (CB). He proposed the following formula for calculating the yield of the Central Bank[]:
Based on the linearity of the relationship between the return of a stock and an index, W. Sharp assumed that there is a complete correlation between these random variables, that is, a correlation dependence with a correlation coefficient modulo equal to one.
William F. Sharp[]
Thus, the yield of an individual security (share) according to formula 1 contains three terms.
The first, the Alpha coefficient or bias coefficient, characterizes the “own, unsystematic” contribution to a particular stock. The second component, equal to the product of a coefficient called the Beta coefficient or slope coefficient, and the return of the stock index RI, reflects the “systematic, market” influence on the return of a given security. Finally, the third term on the right side of the equation, ε, gives the size of the error for the i-th stock, the use of which allows us to close the first two terms on the left and the stock return on the right into equality.
Of course, Formula 1 works better for index paper. That is, for a stock included in the RI index basket. Then it is logical to write ri as riI.
You can interpret the range of values of the Beta coefficient (hereinafter briefly referred to as “Beta”) as follows:
- Beta<0 – inverse correlation between the return of a stock and the index, i.e. as RI increases, ri decreases and vice versa.
- Beta=0 There is no correlation between the stock and the selected index.
- 0<Beta<1 – direct dependence, the volatility (degree of variability) of the stock is less than the volatility of the index.
- Beta=1 – a clear direct relationship between the stock and the index. The volatilities of the stock and the index are the same.
- Beta>1 – direct dependence, positive correlation. The volatility of the index is higher than the volatility of the given stock.
How Beta behaves at two different positive values is well illustrated by the figures below[] (ε is taken equal to 0):
For stock A: Beta=1.2 (>1), Alpha is positive and equal to 2%. For stock B: Beta=0.8 (<1), Alpha is negative and equal to minus 1%. From elementary geometry Beta is the tangent of the angle of inclination of the straight line to the abscissa axis. Hence the second name Beta - slope coefficient.
The larger angle of inclination of the straight line for stock A to the x-axis (RI) causes a sharper change in ri when RI changes, compared to the straight line for stock B. In addition, a clear geometric meaning of Alpha coefficients is given. They give values of ri at RI=0.
Beta is calculated as follows:
What covariance, dispersion and standard deviation (RMSD) are was explained in detail in the introductory article “Fundamentals of Probability Theory for Investors. From the concept of probability to the normal distribution." It is obvious from the formula that Beta has no dimension.
2. EXAMPLE OF CALCULATING THE BETA COEFFICIENT OF A STOCK
Let's determine Beta for Apple shares, as of March 22, 2019, the world's largest public company by capitalization ($923 billion)[]. The main trading platform is the NASDAQ exchange. Ticker: AAPL. The paper is included in the basket of key American indices – DJIA (Dow Jones Industrial Average) and S&P500.
We will choose the end of 2021 as the time period. Let's take[] 15 closing price values of AAPL for the first day of each month from 12/01/17 to 02/01/19 inclusive and the corresponding S&P500 values.
We calculate the return (monthly) of the stock and index (in%) as follows:
(Slast-Sprev)/Sprev*100.
Here Spred is the previous value of the value (stock price or index value), Slast is its subsequent value.
Let's summarize the results in a table:
Yellow color corresponds to AAPL shares, green color corresponds to the S&P500 index.
Next, in Excel, apply the KOVAR function from the “Statistical” section to the profitability columns. We get the covariance value cov(AAPL,S&P500)=16.344. To calculate the variance D(RI), you can use two Excel formulas from the same section of statistical functions: VAR and VAR. The first will calculate the variance for a separate sample, the second - for the general population of values. What is a sample and a population, and what is their difference, also see in the above-mentioned article on our website “Fundamentals of probability theory for an investor...”.
We divide the covariance by the variances and get Beta, separately for the sample, Beta (select) = 0.744 and for the general population, Beta (gs) = 0.802.
It turns out that AAPL shares (over the general population) behave in relation to the S&P500 index during the period under review, with the selected (monthly) frequency, almost like shares B from the example of the previous section (see figure). We do not take into account the alpha coefficient.
3. BETA COEFFICIENT AND SECURITY PORTFOLIO RISK
The formula for calculating the Beta coefficient of a portfolio of securities (stocks) is:
Beta relates not only the returns of a security and an index (reference portfolio), but also the risks of an individual security (SE) and the index. Let us recall that the risk of the Central Bank is understood as the dispersion of its profitability (D) or standard deviation (σ)[]: D=σ2.
In accordance with the “market model”[], the total risks of the security and the portfolio as a whole are written as follows:
The total risk of an individual stock and the entire portfolio depends on market risk (the first term βiI2σI2 for a stock or βpI2σI2 for a portfolio) and on its own risk (the second term σεi2 for a stock and σεp2 for a portfolio).
Even a novice investor knows that the total risk of a portfolio can be reduced by maximizing its diversification. By increasing the number of shares of various companies, the trader mitigates the negative impact of failures in individual positions. The ideal case is when the set of securities completely copies the index basket, for example, the S&P500. Then β of the portfolio is equal to 1 (taking into account the calculation error) and the total risk of the portfolio σp2 is due only to the market risk σI2.
The transition of the overall portfolio risk into market risk, with an increase in the number of companies represented in it, is demonstrated by the graph[]:
4. EXAMPLE OF CALCULATING THE BETA COEFFICIENT OF A STOCK PORTFOLIO
According to formula 3, to calculate the Beta of a portfolio, you need to know the Beta of each stock (company) and its share in the portfolio.
Let’s say you need to determine as of 02/01/2019 the Beta of a portfolio consisting of Apple (AAPL) discussed above, as well as Microsoft (MSFT), Amazon (AMZN) and Facebook (FB). We again choose the S&P500 as a standard, the time period and frequency of information collection are similar to the example with Apple: quotes for the first day of each month from 12/01/17 to 02/01/19.
Suppose an investor's portfolio composition preferences are: 50% AMZN, 25% MSFT, 15% AAPL and 10% FB. Let’s say a total of $1 million was invested, then 0.5 million was invested in AMZN, 0.25 million in MSFT, 0.15 million in AAPL, and 0.1 million dollars in FB.
Let's use the already existing array for AAPL and S&P500 and pull out[] the corresponding quotes for AMZN, MSFT and FB.
Let's process stock quotes and S&P500 values, as was done when calculating Beta for Apple above. Let us make the assumption that our data is a general set of monthly values of the studied quantities in the interval 12/01/17-02/01/19.
Let's summarize the results in the following table:
In the yellow sector of the table, the covariances of stock returns relative to the S&P500 returns are calculated. In the green field is the dispersion of S&P500 returns (already calculated earlier). In the blue field is Beta for each stock, equal to the ratio of the corresponding covariance to the dispersion of the index return. Finally, in the bottom row of the table is the total Beta of the portfolio, based on the weights of each stock (company).
It can be seen that Microsoft is closest to the index in terms of profitability (Beta = 1.03), and Facebook is the furthest away (Beta = 1.98). To an increase/decrease in S&P500 yield of 1%, shares of Zuckerberg's company react by 2%.
A portfolio with Beta=1.52 is quite aggressive - the risk level is 52% higher than the market average for the S&P500.
What should an investor do if he or she is trying to reduce the risk of a portfolio to the average market (index) risk when dealing with these four issuers?
On the one hand, it would seem easiest to fill the entire portfolio exclusively with MSFT shares with Beta = 1.03. But what about diversification then?
Based on Beta coefficients, it can be proposed to increase the share of issuers with Beta close to 1 and reduce the weight of securities with Beta far from 1. For example, a portfolio composition of 50% MSFT, 30% AAPL, 15% AMZN and 5% FB would give a total portfolio Beta of 1.14. At the same time, there will be an opportunity to make good money on sharp upward movements of AMZN and FB with an increase in index profitability.
When forming a portfolio, you need to remember about dividends on shares. In our model, during the analyzed period, shareholders were pleased with Apple: three quarterly payments of $0.73 and one of $0.63 per share; and Microsoft: three times at 42 cents and one time at 46 cents per share.
Is it a lot or a little? The total dividend for the year under review for Apple is $2.82 per share, for Microsoft – $1.72 per share. Let’s compare with the share price at the beginning of investment (01/01/18) – Apple cost $167.43, Microsoft – $95.01. The total dividend flow for the year is 2.82/167.43*100=1.68% per Apple share and 1.72/95.01*100=1.81% per Microsoft share. Here's an approximate parity.
5. BETA-NEUTRAL PORTFOLIO AND PAIRS TRADING
Besides one, the other key Beta value for a portfolio is zero. A portfolio for which Beta = 0 is called beta neutral or market neutral. The neutrality of a portfolio of securities or other financial instruments is the basis of the pairs trading strategy.
What is good about a portfolio with Beta = 1 or about 1?
It eliminates its own risk. The standard deviation of the portfolio return is equal to or almost equal to the standard deviation of the stock index return. In terms of profitability, such a portfolio moves along with the index. Its profitability increases as the index profitability increases, but, alas, falls as the index profitability decreases.
Zeroing Beta results in the fact that the portfolio's return does not respond to changes in market returns and depends only on the relationship between the stocks included in it.
How to bring the total Beta of a portfolio to zero?
The first, most understandable way is to introduce papers with positive and negative Betas into it. Having calculated (selected) the necessary weights, you can reduce Beta to zero. The method, no matter how understandable, is almost impossible to implement in real life. Finding a stock that would steadily fall while the index is rising is not easy. And how reliable is such a tool for long positions?
It's much easier to do it differently. Create a portfolio of long and short positions. Then for long positions Beta will be traditionally positive. For short ones - negative, modulo equal to positive Beta, if such securities were purchased.
Let us illustrate this using the example of stock quotes given in the previous section.
If half of the portfolio is made up of a long position in Microsoft shares with Beta = 1.035, and the other half is made up of a short position in Apple shares with Beta = 0.802, then the final Beta of the portfolio will be equal to: 0.5 * 1.035 + 0.5 * (-1 )*0.802=0.116. Quite close to zero. If an investor were to reverse the directions of positions, that is, open half of the portfolio longs in Apple, and shorts for the other half in Microsoft, then the Beta of the portfolio would change sign to the opposite and become = -0.116.
In a set of two stocks, it is very easy to calculate the weights so that Beta is exactly zero. It is enough to solve a system of two equations with two unknowns:
In our case (Microsoft is long, Apple is short), solving the system, we have X(Microsoft)= 0.4366, X(Apple)=0.5634.
Verification: 0.4366*1.035-0.5634*0.802=0.000342. That is, taking into account the rounding of scales and Bet to thousandths - a “strong” zero.
How to make money with a beta neutral portfolio?
This is written in detail in the articles in the “Pairs Trading” category of our website. It is necessary to select a pair of shares or other assets with a high degree of correlation (with a correlation coefficient close to 1) and operate with a spread. Open long positions on an undervalued stock and short positions on an overvalued one on a wide spread and close them on a narrow spread.
Hedge funds are especially fond of such strategies.
In conclusion, it should be noted that the Beta coefficient of an individual security or portfolio is a continuously changing value and is subject to recalculation when moving from one time frame to another. In addition, it depends on the size of the quote sample.
Vladimir Nalivaisky
NOTES AND LINKS
- "Beta Neutral Portfolio", Wikipedia
- "Sharpe, William", Wikipedia.
- https://finviz.com
- https://finance.yahoo.com
- “Root Mean Square Deviation”, Wikipedia
ABBREVIATIONS USED
CB – security; in the text, CB refers to a share RMS – root mean square (root mean square, standard) deviation, σ
Data for constructing beta coefficient by information companies
The beta coefficient is used by many information and investment companies to assess systematic risk: Bloomberg, Barra, Value Line, etc. To construct the beta coefficient, monthly/weekly data over several years is used. The table shows the main parameters for assessing the indicator by various information companies.
★ Investment appraisal in Excel. Calculation of NPV, IRR, DPP, PI in 5 minutes
| Information companies | Historical observation period | Frequency |
| Bloomberg | 2 years | A week |
| Barra | 5 years | Month |
| Value Line | 5 years | Month |
You can see that Bloomberg uses a short-term assessment of the indicator, while Barra and Value Line use monthly data on stock and market returns over the past five years. Long-term assessment can be greatly distorted due to the influence of various crises and negative factors on the company's shares.
Take our proprietary course on choosing stocks on the stock market → training course
Where to look at Alpha coefficient
Calculating all the inputs for the alpha formula will require a lot of statistical data over several years. We will not pose such a task. For the average investor, ready-made and already published values of the coefficient α are sufficient. Data can be found on the Internet on specialized services for searching and comparing funds. For example, on pif.investfunds.ru, where you can compare funds by several coefficients at once, including α relative to the Moscow Exchange index. To view the required indicators, a free registration is enough.
For convenience, download the table of mutual funds in Excel and filter by alpha. We get 43 funds with a positive coefficient α out of 248 available positions. 205 mutual funds on the list have negative values, and their value reaches minus 7.31. This is not to say that this is a death sentence for the funds at the bottom of the list. Perhaps in a couple of years they will show positive results and change leaders in the TOP. But at the time of analysis, statistics from the previous 3 years indicate either unsuccessful investment decisions or that management fees “eat up” the investor’s profit.
In a global market dominated by mutual funds, there are far more resources available for uncovering the alpha and beta of mutual funds. Data sources could be, for example, fund screeners from the Wall Street Journal or Bloomberg. Here the situation with alpha is better than in Russia: at least ¼ of positive management results from more than 40 thousand funds. However, shares of mutual funds in Russia are available in a limited manner only to qualified investors and holders of a brokerage account with a foreign broker.
Beta coefficient in the capital asset pricing model - CAPM
The formula for calculating the return on shares using the CAPM (Capital Assets Price Model, W. Sharpe model) is as follows:
Where:
r is the future expected return on the company's shares;
rf – return on a risk-free asset;
rm – market profitability;
β – beta coefficient (a measure of market risk), reflects the sensitivity of changes in the value of a company’s shares depending on changes in market profitability (index);
The CAPM model was created by W. Sharp (1964) and J. Linter (1965) and allows you to predict the future value of the return on a stock (asset) based on linear regression. The model reflects the linear relationship between the planned return and the level of market risk, expressed by the beta coefficient.
The yield on a risk-free asset , in practice, is taken as the yield on government securities GKOs, OFZs. The yield on them in Russia is about 12%. The yield can be viewed on the Central Bank website in the section “GKO-OFZ Market Rates”.
To calculate market returns, use the return of an index or index futures (MICEX index, RTS index for Russia, S&P500 index for the USA).
Calculation formula
The formula for calculating the β coefficient is as follows:
As you can see, without basic knowledge in the field of higher mathematics, it is quite difficult to understand this. That's why I'll explain it with my fingers. The essence of the calculation is to compare the dynamics of changes in the market value of specific shares with the dynamics of the stock market as a whole.
If the volatility of the securities in question exceeds the volatility of the market as a whole, this indicates that they are more sensitive to changes in market conditions. This, in turn, tells us that investing in them is subject to greater risk.
In this case, there is no need to cover the entire market and enter into the formula the values for each share of its component. In this case, it is enough to use the value of the stock index (which itself represents the average value of the market value of shares belonging to a certain industry or combined according to some other criterion).
In this case, the Moscow Exchange index can be used for shares of Russian issuers, and for securities of the US stock market, for example, the S&P500 index will be relevant.
Moscow Exchange and S&P500 indices
Beta coefficient can be calculated both for individual stocks and for the investor’s portfolio as a whole. The beta coefficient of a portfolio is calculated as the average value of the Beta coefficients of the stocks included in it (taking into account their weights).
How to calculate this coefficient for a person who is not burdened with knowledge in the field of higher mathematics? I hasten to reassure you, paraphrasing the statement of one of the heroes of Gaidai’s immortal comedy, I will say: “Everything has already been calculated for us!”
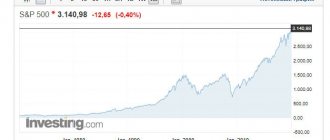
You can easily find data on this coefficient on many sites dedicated to the subject of investment and stock trading. For example, here is a picture with a chart and main indicators of Novatek shares, taken from investing.com:
Example of calculating beta coefficient in Excel
Let's calculate the beta coefficient in Excel for the domestic one. This company has ordinary shares, the quotes of which can be viewed on the website finam.ru in the “Data Export” section. For the calculation, we took monthly quotes for the shares of OJSC Gazprom (GAZP) and the RTS index (RTSI) for the period from 01/31/2014 to 01/31/2015.
Next, you need to calculate the returns on the stock and index; for this we use the formulas:
D6=LN(B6/B5)
E6=LN(C6/C5)
To calculate the beta coefficient, it is necessary to calculate the linear regression coefficient between the return on shares of OJSC Gazprom and the RTS index. Let's consider two options for calculating the beta coefficient using Excel.
Option #1. Calculation via Excel
The calculation through Excel formulas looks like this:
=INDEX(LINEST(D6:D17,E6:E17),1)
Option #2. Calculation via the Data Analysis add-on
The second option for calculating beta uses the Data Analysis Excel add-in. To do this, go to the “Data” section in the main menu of the program, select the “Data Analysis” option (if this add-in is enabled) and select “Regression” in the analysis tools. In the “Input interval Y” field, select the returns of the Gazprom OJSC shares, and in the “Output interval X” field, select the returns of the RTS index.
Next, we will receive a regression report on a separate sheet. Cell B18 shows the value of the linear regression coefficient, which is equal to beta = 0.46. We will also analyze other parameters of the model, for example, the R-squared indicator (determinism coefficient) shows the strength of the relationship between the profitability of the Gazprom share and the RTS index. The coefficient of determinism is 0.4, which is quite low for accurately predicting future profitability using the CAPM model. Multiple R is a correlation coefficient (0.6), which shows the existence of a relationship between the stock and the market.
A value of 0.46 beta coefficient for a stock indicates moderate risk and at the same time the co-directionality of changes in returns.
| ★ InvestRatio program - calculation of all investment ratios in Excel in 5 minutes (calculation of Sharpe, Sortino, Treynor, Kalmar, Modiglanca beta, VaR ratios) + forecasting rate movements |
Pros and cons of the Alpha coefficient
The advantages of using the Alpha coefficient include the following:
- The alpha calculation is based on extensive statistical data over several years. This makes its value based on large volumes of real-world results. Of course, this does not eliminate the element of chance, but it reduces it to a minimum. Jensen himself included 4-6% assumptions in his studies.
- The investor receives a ready-made numerical measurement of management quality. Based on the indicator, he can judge the qualifications and professional intuition of the manager.
- Alpha takes into account not only profitability, but also a measure of risk in the form of beta included in the formula. Thus, from two funds with equal returns, he can choose the one with the best alpha.
I also recommend reading:
BCS losses: should investors worry?
BCS has serious problems with losses
What constitutes the advantages of alpha also partly contains its disadvantages, including those due to Russian specifics.
- The need to collect large statistical data makes its calculation the province of a narrow circle of professionals. For the average investor, it is too labor-intensive to independently double-check the value of α.
- Positive alpha based on management results in the past does not at all entail the same effectiveness in the future. A measure of success could be a fairly long period of observation, as was the case with Michael Jenson. However, in the young Russian market, so many changes occur over 10–15 years that the value of calculating the coefficient over such a horizon becomes negligible.
- Already in the alpha formula itself, uncertainty is initially built into the form of the beta coefficient (a measure of risk). And, as we know, it changes over time, especially in volatile markets like the Russian one.
Disadvantages of Using Beta in the CAPM Model
Let's consider a number of disadvantages inherent in this coefficient:
- The difficulty of using beta to value low-liquid stocks. This situation is typical for developing capital markets, in particular: Russia, India, Brazil, etc.
- It is not possible to evaluate small companies that do not issue ordinary shares. Most domestic companies have not gone through the IPO procedure.
- Instability of beta coefficient forecast. Using linear regression to estimate market risk from historical data does not provide accurate risk forecasts. Generally, it is difficult to predict beta for more than 1 year.
- It is not possible to take into account the company’s unsystematic risks: market capitalization, historical profitability, industry affiliation, P/E criteria, etc., which influence the expected profitability.
Take our proprietary course on choosing stocks on the stock market → training course
Should you use odds?
Of course, everyone decides for themselves whether it is worth focusing on the values of the coefficients when choosing a fund. In our opinion, coefficients can be used, but only as auxiliary information. In this case, it is necessary to use it according to the coefficients in total, and not rely on only one of them. And, of course, the coefficient values must be calculated relative to the correct standard (index).
The final criterion by which effective management companies and funds should be determined is the presence of a capital management system. If a fund has a high result and good ratios, then it is necessary to understand the ways in which this result is achieved. If the results depend on one single manager, you will have to closely monitor his career, because the effectiveness of your investments will depend only on him. If the company has built a capital management system, then in this case the effectiveness of your investments will not depend on one person. On the contrary, the human factor here is already reduced to a minimum, and the system itself is the intellectual property of the company.
Beta Coefficient Modification
Since the coefficient proposed by U. Sharpov did not have proper stability and could not be used to predict future profitability in the CAPM model, various scientists proposed modifications and adjustments to this indicator (adjusted beta, modified beta). Let's consider the adjusted beta coefficients:
Modification of the beta coefficient from M. Blum (1971)
Marshall Bloom showed that over time, the beta coefficients of companies tend to 1. The formula for calculating the adjusted indicator is as follows:
Using these weights allows for a more accurate prediction of future systematic risk. This modification is used by many news agencies, such as Bloomberg, Value Line and Merrill Lynch.
Beta modification from Bava-Lindsberg (1977)
In his adjustment, Lindsberg proposed calculating a one-sided beta coefficient. The main postulate was that most investors do not consider changes in profitability above a certain level as a risk, and only what is below the level is considered a risk. The minimum level of risk in this model was the return on a risk-free asset.
Where:
ri – stock return; rm – market profitability; rf is the return on the risk-free asset.
Beta modification from Scholes-Willims
β-1, β, β1 – beta coefficients for the previous (-1) current and next (1) period;
ρm – autocorrelation coefficient of market returns.
Beta modification from Harlow-Rao (1989)
The formula reflects one-sided beta, with the assumption that investors view risk only as a downward deviation from average market returns. In contrast to the Bava-Lindsberg model, the level of average market profitability was taken as the minimum level of risk.
where: μi – average share return; μm – average market profitability;
In addition to the beta coefficient, other risk-return indicators of an investment portfolio and mutual fund are used in practice; you can learn more about modern investment evaluation indicators in my article: “Assessing the effectiveness of investments, investment portfolios, shares using an example in Excel.” Read about the practice of assessing investment risk in the article: “Methods for assessing risk VaR (Value at Risk). Market risk. Example of calculation in Excel.
What is beta used for?
In practice, beta is used in two cases.
The first is forecasting the movement of a stock in the future. If a stock has a beta of 1.5, then it is logical to assume that if the market grows by 10%, it will rise in price by 15%. Moreover, the longer the period of time taken, the more accurate the forecast will be.
The disadvantage of this approach is that beta shows the past relationship between the asset and the market. And if the market situation has changed (or the stock itself has changed), then the forecasting will be, to put it mildly, inaccurate. You can't accurately predict a stock's behavior based on past results, you can only make guesses.
Therefore, it is more correct to say this: if a stock has a beta of 1.5, then in the future, most likely, it will rise in price by 15% if the market grows by 10 during this period.
Don't forget this point.
And the second case of practical application of beta is to assess the success of fund management. By analyzing alpha and beta, you can understand where the manager showed himself to be more professional, and where the market allowed the fund to grow - and the manager did not have much merit in this.
Beta for US stocks
There are services that allow you to estimate the beta coefficient for many companies and highlight the most interesting ones. We will use the Finviz service. To find stocks that are less sensitive than stock market fluctuations, you need to set the beta coefficient to less than 1.
Filtering US stocks by beta less than “1” allows you to find stocks for a conservative investor whose volatility is lower than that of the S&P 500 Index
How to understand beta
Ok, we found a beta. How to interpret it?
If beta is greater than 1. This means that the stock fluctuates significantly more than the market. For example, if beta is 2, then if the market rises by 10%, the stock will rise by 20%. And, similarly, if the market falls by 10%, the stock will fall by 20%. In the US market there is such a term as high-beta stock. These are the most volatile stocks that attract a lot of speculators, since you can make good money on a wide movement. Long-term investors should avoid stocks with excessively high beta.
Here's another interesting article: How to buy stocks using the Graham ratio
If beta is 1 or so . This means that the volatility of the market and the security is approximately at the same level. And if the market grows by 5%, then the stock will also rise by about 5%. A conservative investor who wants to earn approximately the market level should select stocks with just such a beta.
If beta is less than 1 but greater than 0. This means the stock is less volatile than the market. For example, with a beta of 0.5, if the market grows by 20%, the stock will only rise in price by 10%. On the other hand, if the market falls 20%, the stock will only lose 10% in value. By including such stocks in your portfolio, you limit potential returns while reducing risk.
If beta is 0. This means that the stock is not correlated with the market at all. This happens, but rarely. Most often, startups and, on the contrary, well-developed companies that are growing without threats from external factors have zero beta. An example is shares of telecoms and retailers.
If beta is less than 0. This means that the stock is moving counter to the market. For example, shares of gold mining companies traditionally rise when the market falls, since gold is considered a protective asset and investors shift to it in unclear situations. You can hedge your risks with negative beta stocks. When the market rises, such shares will fall, but when they fall, on the contrary, they will rise.
Conclusions and recommendations
- The considered coefficients have a number of disadvantages, and therefore do not fully allow us to evaluate the effectiveness of the results demonstrated by the manager.
- When choosing a management company and fund, you can use the ratios as auxiliary information. When making a final decision, you need to focus on the capital management system (methods) that is used in a particular company.
- It is worth remembering that the main task of a management company is to create an effective capital management system. High quality of capital management and coefficient values will be a consequence of completing this task.