The main question of every owner: How much money did the company earn over a certain period?
To answer this, there is a CashFlow (CF) report, otherwise there is a cash flow report.
Users of CF can be both internal structures of the company: from accounting to management, and external: higher organizations, banks, investors, statistical authorities and others.
The CF report provides users with data to analyze and evaluate the company in the following areas:
- assessment of the level of liquidity and financial stability of the company;
- assessment of the financial discipline of both individual financial centers and the company as a whole (based on the CF, a plan-fact analysis of the BDDS is carried out).
The report also answers the questions:
- how the company’s cash flows were actually distributed in the reporting period (what the money was spent on and where it came from);
- whether the company generates a sufficient amount of cash to support its core activities;
- whether the company has a source of funds to support investment activities.
In the previous article “A penny saves the ruble. How to properly plan cash flows” we talked about approaches to the formation of cash flow accounting, which is one of the forms of planning and the most important tool for liquidity management. Now, as promised, we will consider approaches to generating net cash flow Cash Flow (CF).
What are multipliers in simple words?
Multiples are financial ratios for valuing a company and comparing it with others.
Financial multiples allow you to quickly understand how expensive or cheap a company's shares are valued. Many investors make decisions to buy stocks based on these values alone. In principle, this is quite enough for a superficial analysis.
The big advantage of these indicators is that these estimates are equally suitable for both large and small businesses, since all formulas are calculated in relative quantities.
Multipliers allow you to quickly assess the investment attractiveness of a business in the sector and reflect the relationship between the company’s market capitalization and the financial performance of the business.
When selecting and analyzing companies, multiples are compared from the same industry, since almost every sector has its own nuances. This is especially true for technology and IT companies.
Even Benjamin Graham (author of The Intelligent Investor and value investing strategy) used multiples to value businesses back in the 1930s and became very rich.
P/E multiplier
The most popular and simple multiplier is considered to be “P/E” (price to earnings), “Price/Profit”.
Formula for calculating P/E
P/E = [Price] / [EPS] = [Share Price] / [Earnings Per Share] or P/E = / [Earnings] = [Total Capitalization] / [Company Earnings]
P/E shows how many years it will take the company to recoup its investment while maintaining current profits.
The lower the P/E ratio, the cheaper the stock. The optimal P/E value is considered to be up to 20 (for the IT sector up to 30).
Through P/E, investors can indirectly understand the fair value of a company, or more precisely, how undervalued or overvalued its shares are.
For example, the utility sector is compared. One company has P/E=10, the other P/E=25. The overestimation of the second one immediately becomes visible. In this case, the investor should conduct a little research into what causes this situation.
The paradox of the market is that often investors simply do not notice forgotten companies with low P/E. This is due to an amazing pattern on the stock exchange: the more expensive the price of a business, the greater the chance that it will rise in price even more. Investors like to make profits here and now, rather than wait for revaluation. Therefore, they massively buy what is growing, pushing the price even higher. This approach is more reminiscent of a speculative view.
For example, in 2021, traders bought Tesla shares with P/E=1400, this is simply fantastic. They either don't know anything about investing or they just want to make a quick buck on growth.
P/E cannot be used to value unprofitable companies.
E/P Ratio The inverse of E/P shows the annual return as a percentage. You can compare risk-free yields on government bonds when choosing companies.
It is worth making a reservation: high P/E ratios can only be justified in the case of high business growth rates, or rather profits. For this purpose, the PEG ratio is used.
PEG = [Future P/E] / [5 Year EPS Growth Rate]
Balance Sheet Multipliers
P/BV (Price to Book value) multiplier
Next, we will consider balance sheet indicators or indicators based on the value of assets (share capital). The main representatives of these indicators are EV/BV, P/BV, P/BE and Tobin's Q multiplier. As part of our course, we will look at the most common of them - the P/BV (Price to Book value) multiplier. Here the numerator is the share price and the denominator is the book value of equity. If the numerator is price (P), then the denominator should include those assets that only shareholders have the right to claim, that is, the book value of the shares, which corresponds to net assets. If the numerator is business value (EV), then the denominator must include all the company's assets.
When calculating the book value of equity, the portion of equity that is formed by preferred shares should not be taken into account, since the market value of equity relates only to ordinary shares.
P/BV Capitalization of the company divided by the book value of share capital (assets minus liabilities), Price/Balance Value.
P/TBV A more conservative valuation that takes into account only tangible assets, from which liabilities are subtracted to calculate the denominator, Price/Tangible Balance Value.
The advantage of balance sheet indicators is that they are less susceptible to local fluctuations in the denominator. The downside is that the balance sheet valuation of equity is highly dependent on accounting features. If balance sheet multipliers are negative, they have no practical use. A similar situation can arise with multi-year losses, but it is much less common than negative P/E. The balance sheet P/BV multiplier can be related by a formula to the income multiplier, already known to us P/E, as follows:
ROE is the return on equity and is defined as net income divided by net asset value.
As can be seen from the formula above, P/BV significantly depends on ROE, which means that shares for which the P/BV multiplier is below the industry average cannot be considered undervalued. In this case, it is necessary that the ROE value is not lower than the industry average and vice versa.
If the return on equity (ROE) is equal to the return required by investors, then, purely mathematically, the P/BV ratio will be equal to one, regardless of the company's growth rate.
| P/BV > 1 | The company's assets generate more income than the return investors require on their investment in the company. |
| P/BV < 1 | Perhaps the company should cease its activities and sell off its assets. It can also serve as an indicator of poor business management. |
In what cases should balance sheet multipliers be used? Typically, balance sheet multiples are used to analyze companies that have tangible assets as their main assets. These are financial institutions (banks, insurance and investment companies). Often, for such organizations, book values are a good approximation of market values, which is not the case for EBITDA-based measures for this sector. These multiples can also be used to value distribution activities (based on inventory costs), or to value those companies that will be liquidated.
The P/BV multiplier does not allow identifying undervaluation or overvaluation of a company without analyzing the profitability of its activities. A fair level of “asset multiple” is determined by the ratio of investment returns and risk requirements:
Let's give a conditional example: if companies A and B operate in the same industry and have similar operational, financial and corporate risks, demonstrate the same values of the multiple of equity capital, but company A shows a higher return on equity capital (for example, 23% on compared to 17% for company B), it is concluded that company A is undervalued.
When calculating operating cash flow, net profit is adjusted for non-cash expenses (in particular, depreciation is added) and changes in working capital. And cash flows show how much the company actually generated, regardless of accounting tricks when calculating net profit.
P/OCF Ratio of capitalization and operating cash flow, Price/Operating Cash Flow.
P/FCF Ratio of capitalization and free cash flow, Price/Free Cash Flow.
FCF refers to the difference between operating cash flow and capital expenditures. FCF is an excellent metric for assessing a company's ability to pay dividends and implement buyback programs.
It is calculated (simplified) according to the Cash Flow Statement: Free Cash Flow = Cash Flow from Operating Activities - Capital Expenditures. Free Cash Flow = Cash Flows From Operating Activities - Capital Expenditures.
| P/FCF < 20 | This value is considered normal. |
| P/FCF < 15 | Indicates a healthy business. The company still has money that can be used for dividends or share repurchases. |
The main disadvantages of using the P/FCF ratio are:
- You cannot evaluate the attractiveness of a particular security using only the P/FCF indicator, since net cash flow indicates the amount of funds that the company can use to distribute dividends. When buying a stock, we evaluate it from at least two sides - dividends and changes in market value. This coefficient takes into account only the first aspect, leaving behind the scenes the efficiency of capital investments (the amount of which is subtracted from net profit when calculating net cash flow). Thus, the return on equity, which we talked about earlier, remains behind the scenes.
- You should be careful when calculating this coefficient. Let's look at the following example: Company A earned 1 million rubles of net profit in a year, and has a cash flow of 1 million rubles. Company B received a loss of 0.5 million rubles, while taking out a loan for 1.5 million rubles, and its cash flow also amounted to 1 million rubles. We get companies with the same cash flow, but different in performance.
Industry, “industry specific” or natural multiples are close in meaning to P/BV (EV/BV) and P/S (EV/S), since to construct these indicators those factors are selected that are decisive for revenue or for asset size.
The main representatives of industry multipliers are EV/Production and EV/Capacity , which take into account the level of production and capacity.
Basically, such analogues are found for mono-product companies (as well as those producing a homogeneous product). First of all, these include commodity companies (oil, gas, gold production).
For example, we often hear news about changes in the level of oil reserves in a particular country or at a particular enterprise. Reserves are the main asset of an oil producing company, since in the oil industry the main capital investments are made in the exploration of reserves (they carry great uncertainty regarding other types of costs in this industry). Reserves are the main and, moreover, very liquid asset of a mining company.
Let us give an example of natural indicators from other sectors of the economy. For online companies this can be an indicator of revenue per click, for a transport business - the price per 1 ton-kilometer of transported goods, in the real estate sector - the price per 1 square meter. When assessing such indicators, it is worth considering the following: there is a danger of obtaining a large error when bringing heterogeneous products to single natural units.
Let's take an example with cast iron production. The plant can produce various types of products - cast iron pipes or various cast iron products (for example, fences with monograms). Of course, products of the second type will cost more, so in this case the volume of cast iron production (in tons per year) will give us very little information to evaluate this company.
There are also difficulties in translating these indicators into financial ones, and, as a result, difficulties in assessing companies from different industries.
Let us take for evaluation two specific oil producing companies that have the following indicators:
| Company A | Company B | |
| Market price of the share | 2500 rub. | 950 rub. |
| Number of shares | 20 million pieces | 4 million pieces |
| Net profit (E) | 2.5 billion rubles. | 650 million rubles. |
| Revenue (S) | 7 billion rubles | 2.5 billion rubles. |
| Book Value (BV) | 4 billion rubles | 500 million rubles. |
| Free Cash Flow (FCF) | 1.2 billion rubles | 700 million rubles. |
| Oil reserves (PR) | 400 million barrels | 100 million barrels |
We took this data for two companies from their latest annual reports. We also have average values for various indicators for the oil industry (you can calculate them yourself or find them on specialized resources). Let's look at the main indicators that we discussed earlier: P/E, P/S, P/BV, P/FCF, and industry ratio.
P/E calculation
To calculate the denominator, we need to divide net income by the number of shares outstanding: EPS=E/N
EPS for company A is = 2.5 billion / 20 million = 125 rubles / share EPS for company B is = 650 million / 4 million = 162.5 rubles / share
Next, we divide the current market prices of shares of these companies by the corresponding EPS: P/E (A) = 20 P/E (B) = 5.85
Conditional conclusion (other things being equal): investments in company B will pay off faster, and from this point of view it is more interesting for us. However, let's not forget that it is necessary to take into account a combination of factors, and not a single coefficient. Let's record this result and move on to calculating the next indicator.
Calculation of P/S (per share)
Revenue per share for company A was = 7 billion / 20 million = 350 rubles / share Revenue per share for company B was = 2.5 billion / 4 million = 625 rubles / share
P/S (A) = 7.14 P/S (B) = 1.52
P/BV calculation
The book value of one share of company A is = 4 billion / 20 million = 200 rubles / share The book value of one share of company B is = 0.5 billion / 4 million = 125 rubles / share
P/BV (A) = 12.5 P/BV (B) = 7.6
This means that when you buy shares for 1 ruble, you receive 8 kopecks (1/12.5) of the value of the company's net assets. When purchasing shares, 1 ruble of the company's value accounts for 13 kopecks (1/7.6) of net assets.
Calculation of free cash flow per share (FCF/N)
FCF per share of company A is = 1.2 billion rubles. / 20 million = 60 rub. / share FCF per share of company B is = 700 million / 4 million = 175 rubles. / share
P/FCF (A) = 41.67 P/FCF (B) = 5.43 looks much more attractive in terms of net cash flow. By investing 1 ruble in it, you receive 18.4 kopecks in cash flow. While 1 ruble invested in will give only 2.4 kopecks of cash flow.
Calculation of industry coefficient (P/Production)
Let's analyze oil reserves (Production): One share of company A accounts for = 400 million / 20 million = 20 barrels One share of company B accounts for = 100 million / 4 million = 25 barrels
P/Production (A) = 125 P/Production (B) = 38
Let’s bring all the indicators together and look at the companies in comparison:
| Company A | Industry average | Company B | |
| P/E | 20 | > 12,2 | > 5,85 |
| P/S | 7,14 | > 1,3 | <� 1,52 |
| P/BV | 12,5 | > 9,7 | > 7,6 |
| P/FCF | 41,67 | > 20 | > 5,43 |
| P/PR | 125 | > 57 | > 38 |
In this example, with a high degree of probability, you can make a choice in favor of shares of company B; there is a clear undervaluation of the company. However, the P/S ratio did not confirm the undervaluation of the paper. It is also worth considering other factors that we touched on in this course, in particular, trends in the industry in question.
P/BV multiple
Financial multiplier “P/BV” (price to book value), “Price/Book value”. It is the second most important indicator. Often abbreviated as “P/B”.
P/B formula:
P/B = [Market value of company] / [Book value of company assets]
Book value of assets is the net asset value (NAV) of a company. Assets (Total Assets) minus liabilities (Total Liabilities).
P/B shows how many real assets that belong to shareholders are per invested ruble. For example, if P/B = 1.5, then for 1.5 rubles there is only 1 ruble of value.
P/B up to 3 is considered normal values.
You can find companies on the market with a P/B of less than 1. These companies are considered undervalued because their capitalization is less than their book value. In other words, an investor buys a company for less than its real value. For example, P/B = 0.65, then for 0.65 rubles the investor becomes the owner of assets worth 1 ruble.
Benjamin Graham recommended taking undervalued companies. In the 1950s-1970s there were such shares in the USA. After the 1980s, a powerful bull market began, after which the prices of all stocks rose significantly, and there were practically no large businesses left with a low P/B multiple.
The higher the price you pay today, the lower the income in the future. Benjamin Graham
Approaches to automating the generation of reporting forms.
The formation of CF is quite labor-intensive and requires significant time resources, even when formed using the direct method. You can’t do without automation in this matter. You will likely need the help of IT professionals to develop CF reports tailored to your company's specific needs.
The Checkbox service allows you to configure any reports, and you can do this yourself. Indirect CF is now no more difficult to do than direct CF. And with the Checkmark, this method of forming CF will have no disadvantages. You will receive the required report without much effort.
P/S multiplier
“P/S” (price to sales), “Price/Sales” is similar in its idea to P/E. Instead of profit, revenue is used as the denominator.
Formula P/S:
P/S = [Share Price] / [Sales per Share]
Revenue is the total amount of cash (or future benefits) from the main activities of an enterprise for a period. It is a more stable reflection of the financial statements of a business than profit.
The advantage of P/S is that it allows you to compare even unprofitable companies with each other, since revenue cannot be negative.
Normal P/S values are considered to be no more than 2.
P/CF multiplier
P/CF ratio (price/cash flow), “Price/Cash flow. This multiplier is used quite rarely. P/CF shows the performance of the core business activities.
P/CF = [Share Price] / [Operating Cash Flow per Share]
Many companies, in addition to their main activities, engage in investments. In this case, P/CF will help you look at a point-by-point indicator of business performance.
As a minus, we can say that if a company has a large flow of cash from investments, then naturally it can be expensive, so the capitalization rate will be overestimated. Moreover, this does not make the company unattractive for investment.
- Operating profit (OIBDA);
CF structure
The CF structure corresponds to the BDDS form.
In the article we proposed to rely on the following concept of a report:
A report is a table where rows (items) are grouped by income and expenses, and columns (analytics) are grouped by projects, services, departments/CFDs.
Thus, CF is a table where:
- Lines - grouping by types of activities and items (selected based on the required detail).
- Columns - grouping by analysts, set based on the need for analysis and planning for individual analytical sections: types of products/services, projects, departments/central federal districts.
The general formula for calculating net cash flow is:
CF = CFO + CFI + CFF,
Where
CFO: Net cash flow from operating activities
CFI: Net cash flow from investing activities
CFF: Net cash flow from financing activities
EV/EBITDA multiple
The EV/EBITDA (Enterprise value/Earnings before Interest, Taxes, Depreciation and Amortization) ratio is used quite often.
EV Formula:
EV = [Market capitalization] + [Total debt obligations] + [Company's available cash]
EBITDA formula:
EBITDA = [Net profit] + [Income tax expense] - [Tax deductions] + [Non-operating income and expenses] + [Interest payments] + [Depreciation] - [Revaluation of assets]
EV/EBITDA allows you to compare companies regardless of country. The EV indicator takes into account all the company's debts, and the calculation of EBITDA does not depend on the accounting features of individual countries. For example, different countries' tax and depreciation requirements may vary significantly.
The lower the EV/EBITDA, the cheaper the company. Values no more than 7 are considered optimal.
Cash flows
Cash flow CF
(Cash flow is read cash flow, cash flow) - the movement of funds within the framework of one project or a specific direction. Flow means money in accounts and in the cash register (free reserve) that remains after the company’s activities for the final period of month, quarter, year, etc. It is displayed as a total amount, both negative and positive, which is formed from receipts and payments. Accordingly, a positive cash flow is a profit, a negative one is a loss. After all, a company that has new or additional funds on hand can actively use them to invest in another business or reinvest and receive even more income and profit. Good CF ratios are a strong selling point for bankers and lenders considering lending.
Operating Cash Flow ODP ODP = Net Income – Non-cash expenses (Depreciation, Impairment) – Interest (paid) on loans – Income Tax Money received or spent during internal (operational) business processes. It is calculated as the sum of working capital and cash inflow. If the company is solvent, the result will be positive.
Investment cash flow . Money received from the sale of long-term assets, or spent on investment needs (construction, investments).
Financial cash flow . Money received from the provision of credit/loan, or paid in the form of dividends, loan repayments or share repurchases.
DEBT/EBITDA multiplier
The Debt/EBITDA ratio (DEBT/EBITDA) shows a company's leverage relative to its ability to generate cash.
Instead of debt, the net debt indicator is often used, then the multiplier is called “netDebt/EBITDA”.
When analyzing and selecting a company, EV/EBITDA is plotted along the X-axis, and DEBT/EBITDA is plotted along the Y-axis. The closer the company is to the origin, the cheaper it is. This simple analysis allows you to find cheap stocks.
Market capitalization
This multiplier has an absolute value, so companies can only be compared based on them conditionally.
Market capitalization formula:
Market capitalization = [Share price] × [Total number of shares]
The market capitalization indicator shows how much it costs to buy the entire company at the last price on the stock exchange. Of course, this is only a convention, since stock quotes are constantly changing and it is impossible to draw an unambiguous conclusion from them.
When calculating market capitalization, outstanding preferred shares, bonds, debt and other securities are not taken into account.
- EPS (earnings per share);
- ROE (return on equity);
- ROA (return on assets);
- ROS (return on sales);
Company value
Market Capitalization (MC)
Market Capitalization:
MS=Weighted average number of shares outstanding * Market price of the share at the end of the period
Market capitalization is a financial indicator used to assess the total value of market instruments, entities and markets. In particular, they distinguish: - Market capitalization of a security - the market value of all issued securities of a certain type. Numerically equal to the product of the market value of a security by the number of securities of this type issued in circulation. — Market capitalization of a joint-stock company is the market value of all shares of this joint-stock company. It is calculated as the sum of the market capitalizations of the shares of the joint-stock company. — Stock market capitalization, an indicator characterizing the scale of operations in the stock market. Defined as the total market value of securities traded on this market.
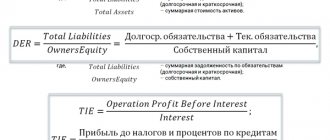
Enterprise value (EV) EV (Enterprise value)
EV = Capitalization + Long-term liabilities + Short-term liabilities
Enterprise value (EV) is defined as the sum of a company's capitalization and debt. The indicator is calculated by adding the company's net debt to the market capitalization, which is calculated by adding the company's short-term and long-term debt, minority interests and preferred shareholders' equity, minus cash and cash equivalents from this amount. Enterprise value (EV) provides investors with a theoretical guide to a company's acquisition price.
Note: EV is an estimate. Investors use valuation ratios to compare companies. The lower the valuation ratio, the more return the investor will receive on the invested capital.
EV/S ratio
EV/S (Enterprise value/Sales, Company value per revenue)
EV/S = (Capitalization + Long-term liabilities + Short-term liabilities) / Revenue, usually over a period of 12 months. For quarterly revenue, the coefficient is extrapolated for the year.
EV/S is a metric calculated by dividing a company's value (EV) by its annual revenue. A high EV/Sales ratio cannot always be regarded as a company being overvalued by the market. Sometimes it reflects investors' expectations about a company's future earnings. Accordingly, if the indicator is higher than the market average, then investors expect an increase in the company's income, and if it is less, then vice versa.
Note: EV/S is an estimate. Investors use valuation ratios to compare companies. The lower the valuation ratio, the more return the investor will receive on the invested capital.
EV/EBITDA ratio
EV/EBITDA (Enterprise value/EBITDA, Company value based on EBITDA)
EV/EBITDA = (Capitalization + Long-term liabilities + Short-term liabilities) / Earnings excluding taxes, interest and depreciation, usually over a period of 12 months. For quarterly revenue, the coefficient is extrapolated for the year.
EV/EBITDA is more often used in comparative analysis when assessing the value of a company. This indicator can be used to judge whether a company is undervalued or overvalued by the market. However, it should be taken into account that EV/EBITDA varies depending on the industry, in particular, a higher indicator is typical for fast-growing industries, and a low one for traditional ones. Here the country factor should also be taken into account: for example, in developing economies a bias may arise, i.e. Traditional industries, not high-tech ones, can develop quickly.
Note: EV/EBITDA is an estimate. Investors use valuation ratios to compare companies. The lower the valuation ratio, the more return the investor will receive on the invested capital.