According to data published by the United States Department of the Treasury, Japan became the leader among holders of government debt. In second place is the leader of previous years - China.
Schedule
Table. Who does the US owe? Holders of United States government debt (trillion dollars)
| Country/State | June 2019 | May | April | March | Fephral |
| Japan | 1.1229 | 1.0110 | 1.0640 | 1.0781 | 1.0688 |
| China | 1.1125 | 1.1102 | 1.1130 | 1.1205 | 1.1309 |
| Great Britain | 0.3411 | 0.3231 | 0.3008 | 0.3171 | 0.3025 |
| Brazil | 0.3117 | 0.3057 | 0.3067 | 0.3117 | 0.3077 |
| Ireland | 0.2621 | 0.2707 | 0.2697 | 0.2776 | 0.2740 |
| Switzerland | 0.2329 | 0.2314 | 0.2269 | 0.2264 | 0.2214 |
| Luxembourg | 0.2310 | 0.2296 | 0.2237 | 0.2302 | 0.2289 |
| Cayman Islands | 0.2266 | 0.2161 | 0.2172 | 0.2195 | 0.2101 |
| Hong Kong | 0.2156 | 0.2040 | 0.2059 | 0.2076 | 0.2024 |
| Belgium | 0.2036 | 0.1905 | 0.1798 | 0.1866 | 0.1813 |
| Saudi Arabia | 0.1796 | 0.1790 | 0.1766 | 0.1700 | 0.1676 |
| Taiwan | 0.1751 | 0.1720 | 0.1711 | 0.1688 | 0.1649 |
| India | 0.1627 | 0.1569 | 0.1553 | 0.1520 | 0.1443 |
| Singapore | 0.1396 | 0.1504 | 0.1393 | 0.1388 | 0.1305 |
| France | 0.1316 | 0.1251 | 0.1247 | 0.1096 | 0.1159 |
| South Korea | 0.1152 | 0.1173 | 0.1151 | 0.1199 | 0.1155 |
| Canada | 0.1116 | 0.1005 | 0.1021 | 0.0997 | 0.0976 |
| Norway | 0.0993 | 0.0993 | 0.0971 | 0.0995 | 0.0971 |
| Thailand | 0.0838 | 0.0814 | 0.0822 | 0.0844 | 0.0909 |
| Germany | 0.0792 | 0.0778 | 0.0728 | 0.0781 | 0.0762 |
| Bermuda | 0.0739 | 0.0691 | 0.0664 | 0.0681 | 0.0669 |
| United Arab Emirates | 0.0515 | 0.0532 | 0.0557 | 0.0556 | 0.0545 |
| Sweden | 0.0494 | 0.0485 | 0.0465 | 0.0479 | 0.0482 |
| Mexico | 0.0490 | 0.0499 | 0.0477 | 0.0447 | 0.0405 |
| Netherlands | 0.0479 | 0.0444 | 0.0450 | 0.0445 | 0.0429 |
| Italy | 0.0454 | 0.0425 | 0.0437 | 0.0440 | 0.0421 |
| Kuwait | 0.0444 | 0.0414 | 0.0402 | 0.0402 | 0.0422 |
| Spain | 0.0426 | 0.0420 | 0.0410 | 0.0409 | 0.0377 |
| Israel | 0.0395 | 0.0361 | 0.0362 | 0.0348 | 0.0354 |
| Australia | 0.0392 | 0.0397 | 0.0391 | 0.0393 | 0.0395 |
| Iraq | 0.0347 | 0.0344 | 0.0354 | 0.0362 | 0.0347 |
| Philippines | 0.0322 | 0.0307 | 0.0273 | 0.0251 | 0.0212 |
| Colombia | 0.0311 | 0.0296 | 0.0297 | 0.0315 | 0.0272 |
| Other countries | 0.5177 | 0.5366 | 0.5356 | 0.5244 | 0.5130 |
| Total | 6.6363 | 6.5391 | 6.4336 | 6.4733 | 6.3748 |
The information described above is based on data published by the US Department of the Treasury. More detailed data can be viewed at the link - https://ticdata.treasury.gov/Publish/mfh.txt
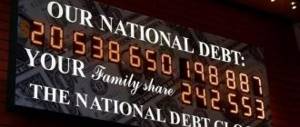
More detailed information about the US national debt can be read at the link -. It also shows the value of the United States government debt in real time.
What is treasury in simple words
Treasuries (from the English “Treasuries” - “treasury”, “treasury”) are debt securities of the United States Department of the Treasury. They are often called "US Treasuries" or "US Treasuries".
In Russia, similar debt securities are called federal loan bonds (OFZ).
The United States finances its state budget with the help of Treasuries. The issuer is the Federal Reserve System. In return, they receive much-needed dollars. Every year their debt grows steadily by $1 trillion. For 2021, its figure is more than 22 trillion. In 2021, the debt has already exceeded $24 trillion.
The Fed (Federal Reserve System) is behind the regulation of the entire process. Analogue of the Central Bank (central bank) in Russia.
Since the largest and most stable economy in the world is the American one, US bonds are considered the standard of security. They are considered the most risk-free securities in the world. Based on their value and profitability, it is possible to make forecasts for the further development of share prices on stock markets (we will talk about this a little later).
The main holders of Treasuries are the Federal Reserve System, as well as countries and the largest funds (hedge fund, mutual funds). In this way, they diversify investment portfolios from the high volatility that characterizes the stock market.
US Treasury yields are extremely low: from 0.2% to 3.0%. Most other countries' bonds have higher yields.
Like other debt securities, Treasuries are issued through public auctions. Due to the great interest in the secondary market, all American bonds have high liquidity. It is even called absolute, that is, in fact, treasuries are equated to money.
Note Treasuries are considered so reliable that they are even considered as money when using leverage (margin trading).
However, on the other hand, analysts talk about the deplorable state of the US national debt. Every year it increases. This is reminiscent of a financial pyramid, where payments to old ones are made at the expense of new investors.
The US national debt in 2021 is 120% of GDP. This seems fantastic, but not the greatest. In Japan, public debt is 250% of GDP.
- Bond yield curve;
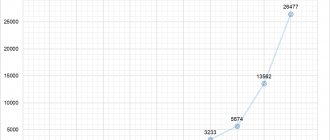
Dynamics of US government debt
The US domestic and foreign national debt is constantly growing. At the legislative level, there is always a “ceiling” - the maximum amount of public debt, above which it is prohibited to increase the debt, but it is regularly revised upward.
Here is the dynamics of the US national debt from 1910 to the present.
Until about 1980, the US national debt grew steadily, and its growth rate was comparable to the growth rate of the American economy (that is, US GDP). In the 1980s, this situation changed, and public debt began to grow faster than the economy. And in the early 2000s, the gap between GDP growth and US national debt began to widen even more.
By itself, the dynamics of the US government debt says little: it is advisable to compare it with the dynamics of GDP growth. Below is the dynamics of US foreign and domestic debt as a percentage of GDP over the past 25 years.
The largest jump in public debt to GDP occurred in 2009, at the time of the financial crisis that began in 2008. In 2012, the level of public debt exceeded the country's GDP and then did not fall below 100% of GDP; on the contrary, the gap continued to widen.
However, if we analyze earlier historical periods, we see that in 1946 the ratio of US government debt to GDP was 146% - about half what it is now.
Types of US Treasury Securities
There are several types of US Treasury bonds:
- Treasury bill (t-bill). A short-term bond whose term does not exceed 1 year. May be calculated in weeks. It is a discount security, meaning there is no coupon yield. Its original price is lower than face value. Investors' profit lies only in the difference between buying and selling. The discount can range from $1000 to $5,000,000. Repayment terms: 4 weeks, 8 weeks, 13 weeks, 26 weeks and 52 weeks.
- Treasury Note (T-Notes). Medium-term bond - from 1 year to 10 years. At the time of issue, repayment terms are 2, 3, 5, 7 and 10 years. At the same time, 2-year, 3-year and 5-year are issued monthly, and 10-year in February, May, August and November.
- Treasury bond (government bonds, T-Bonds). From 10 to 30 years.
- Floating Rate Notes (FRNs).
- Treasury Inflation Protected Securities (TIPS). The denomination is indexed according to inflation data. Plus, a small coupon income is accrued.
What is the current US national debt?
Today, the US national debt is 24.7 trillion. dollars.
A large volume of new treasuries was issued in March-April 2020 as a measure to support the economy and combat the financial crisis caused by the spread of the coronavirus pandemic.
If we compare the size of the US domestic and foreign debt with the American population, it turns out that each resident of the country owes approximately 69 thousand dollars.
The US national debt is about 69 thousand dollars per capita.
Based on the existing dynamics, it was calculated that the growth of the US national debt is approximately $2 million per minute.
There are sites that show an online counter for the growth of the US national debt. And for the first time such a visual counter was installed in the central region of New York in 2004.
If the rate of increase in public debt remains the same as now, then by 2025 it will exceed 30 trillion. dollars.
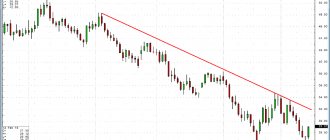
Treasuries and the stock market
There are many securities in the financial cauldron. Everything is interconnected, so the profitability and risks of some affect the values of others.
When bond yields rise, their value on the stock exchange decreases. Investors are investing more in stocks and currencies. This means that if Treasuries fall in price, you can save your money in dollars or American stocks.
Most often, the state of the market is assessed by treasury notes (medium-term bonds). Loan and mortgage rates are tied to them.
You can view current prices for Treasuries on the following websites:
- https://treasurydirect.gov/instit/instit.htm
- https://www.wsj.com/mdc/public/page/mdc_bonds.html
Here are tables with the name of the security, maturity date, its price and coupon yield.
Here you can see information about the largest countries that hold Treasuries:
- China ($1140.0 billion);
- Japan ($1036.6 billion);
- Brazil ($314.0 billion);
- Ireland ($279.6 billion);
- Switzerland ($236.6 billion);
- Great Britain ($227.5 billion);
Since 2021, the Central Bank of the Russian Federation has sold almost all of its reserves of treasury securities and invested in gold. In 2021, the process of leaving the US debt market continued.
History of US government debt
Enormous crises did not pass without a trace; what happened in 1929 dealt a due blow to the stock market. And also to the people who were sliding into a miserable existence. But as fate would have it, wars helped America emerge from complete collapse. First the First, and then the Second World War.
In World War II, the economies of European countries suffered greatly, while hostilities did not take place in the United States. But still, being the owner of a huge debt accumulated since the 1930s, America became the founder of the World Bank. As well as the International Monetary Fund (IMF).
Establishments were happy to provide loans to another government, which had a positive effect on the political situation in the United States.
The authority of the dollar grew, which became the main currency in the world, and the fall of which today will lead to the collapse of the world economy. The strengthening of America's position was facilitated not only by the correct use of the post-war consequences, but also by the active development of business in the 1970s.
How to buy US government bonds
Online purchase
Most purchases are made online, through a brokerage account. There are several options:
- Individual investors turn to Russian brokers who can provide access to foreign instruments. The disadvantage is that the entry threshold is high, from several million rubles, and brokerage accounts are not insured.
- Foreign branches of Russian brokers. The entry threshold is small, but there is a risk of increased taxation.
- Another option is the possibility of opening a brokerage account directly with American brokers. You can buy investment instruments from $300.
Buying paper bonds
It is also possible to purchase bonds in paper form; to do this, you need to contact a foreign bank that provides such a service. The owner is issued a certificate, the minimum value of the security is from $50.
Existing methods for estimating the risk-free interest rate
Let's consider existing modern approaches and methods for estimating the risk-free interest rate based on:
- Yield on bank deposits.
- Yields on government securities.
- Yields on foreign government securities.
- Interest rate for refinancing of the Central Bank of the Russian Federation.
- Interest rates on interbank loans.
Let us examine in more detail in practice how to calculate the risk-free interest rate using these methods.
Calculation of the risk-free interest rate based on the refinancing rate
The next way to estimate the risk-free interest rate is to compare it with the refinancing rate. The refinancing rate is the interest rate at which the Central Bank of the Russian Federation lends to commercial banks. Information on the refinancing rate of the Central Bank of the Russian Federation can be obtained on the website. To do this, in the main menu of the site you need to select the “Statistics” section and in it “Tools of monetary policy of the Bank of Russia and liquidity indicators of the banking sector.”
Calculation of the risk-free rate of return based on the refinancing rate of the Central Bank of the Russian Federation
In the window that appears, at the top there will be a link to statistics on changes in the refinancing rate. Currently the refinancing rate is 8.25%. This rate can be used as a risk-free interest rate.
Refinancing rates of the Central Bank of the Russian Federation (risk-free rate)
What allows America to have such large debt obligations?
When a budget deficit appears in America, the authorities immediately try to cover it through loans. Of course, the hole could be filled by reducing medical costs. In addition, education, tax increases. But the government does not want to anger the people.
The question arises: what allows the States to accumulate such debts? Washington is not afraid to borrow in dollars. Since for him it is a priority currency, over which he has complete control.
If they were unable to pay on time, then they turn on the machine and receive the required amount. But the American authorities are not doing this in order to exclude the collapse of the economy and default.
Default can also occur when America is unable to pay interest on its debts. But this will happen if no other country lends money, which is completely excluded.
However, what may threaten the US is the proportion of government debt to GDP. This figure is 104%, which is considered normal. It is enough for the state to replenish the market a little with new products, and the deficit will be filled.
But it is worth realizing that the funds borrowed by the United States from other countries do not go into the pockets of officials. Moreover, they invest smartly in various areas of life. The state creates new jobs, innovative industries are formed.
As long as Washington is able to pay its debt, there will be no serious problems. In addition, the vulnerability lies in the increase in the percentage of loans relative to GDP.
US Government Borrowing Ratio Table
US external public debt - data as of August 2021.
| State | National debt, billion dollars | Loan, % |
| China | 1110 | 16,8 |
| Japan | 1100 | 16,7 |
| Great Britain | 640 | 9,7 |
| Brazil | 306 | 4,6 |
| Ireland | 271 | 4,1 |
| Switzerland | 231 | 3,5 |
| Luxembourg | 230 | 3,5 |
| Cayman islands | 216 | 3,3 |
According to statistics, Japan and China are considered major holders of US government debt worth 2 trillion. dollars. The average return on all bonds is 2.6% per year. Russian authorities have reduced the number of American securities in the asset reserve, and today Russia has invested only $14 billion.
The US national debt is secured by the Central Bank, which is produced by the country's Treasury. Anyone can buy them at any of the 300 auctions held every year.
Despite the fact that bonds generate less income, they are considered the most reliable securities. Since they are supported by the country’s assets and property.
Yield and inflation
Another criterion for determining the risk-free return limit is inflation. After all, the goal of any investor is not just to get at least some return, but to earn more than inflation, i.e. increase your savings.
Therefore, we can assume that anything that provides income at or slightly above or below inflation is a risk-free investment. Anything that is 2-3 times higher than inflation is already a high-risk investment.
If inflation rises, then the central banks of countries raise the key rate - loans become more expensive and economic growth slows down, and with it the rise in inflation. Consequently, the risk-free return limit also increases.
This was the case in Russia in 2014. To save the ruble from devaluation and slow down inflation, the Central Bank raised the rate to 17% - followed by a jump in the yield of 1-year OFZs, which amounted to 14-15%, as well as the yield on deposits - sometimes it was possible to find a value of as much as 20% per annum.
If inflation slows down, the Central Bank reduces the rate and, along with it, the risk-free return limit decreases. In developed countries, where the economy simply has nowhere to physically grow, this is what happens. Inflation in the USA is close to zero, and so is the Fed rate.
In Europe, deflation is generally raging, i.e. prices are falling. In an attempt to speed up the economy and convert deflation into inflation, the ECB decides to lower the rate - it is quite possible that we will soon see its negative value. There have been no such precedents in economics yet - and economists simply do not know what to do with deflation.